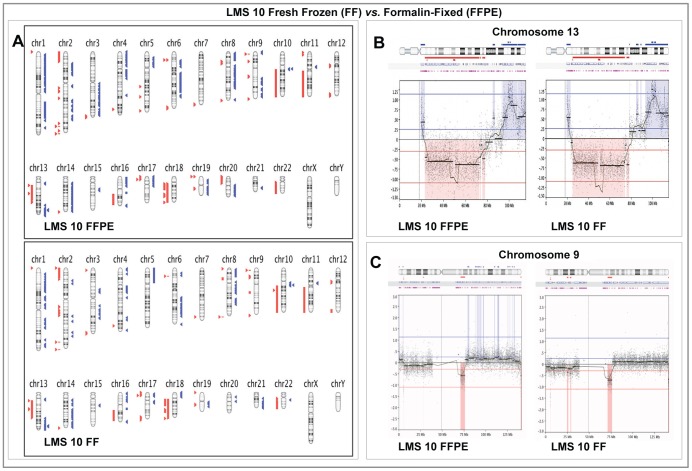
Figure 3. Comparison of Array CGH results in paired Fresh Frozen and Formalin-fixed Paraffin -Embedded samples from LMS 10.
Panel A: Graphical whole-genome views of copy number aberrations (CNAs) identified in both sample types showing close similarities on most chromosomes. Panel B: Higher resolution graphical views of Chromosome 13 showing the close similarity in gain and loss patterns detected in both sample types. Panel C: High-resolution views showing that even though the CNAs identified by the calling algorithm on chromosome 9 are not identical, the moving averages of probe log2 ratios in both sample types remain similar. On Panel A, aberrations called by FASST2 algorithm are represented by blue triangles to the right (amplifications) and red triangles to the left (deletions) of the chromosomes. Double blue and red triangles/lines represent high-level amplifications and two-copy deletion, respectively. On Panels B and C, dots represent individual probe log2 ratios plotted as a function of their chromosomal position with a moving average of probe log2 ratios (wavy dark blue line). Aberration calls are represented by thick black lines with corresponding shaded blue areas above (amplifications) and red areas below (deletions) the zero line.

