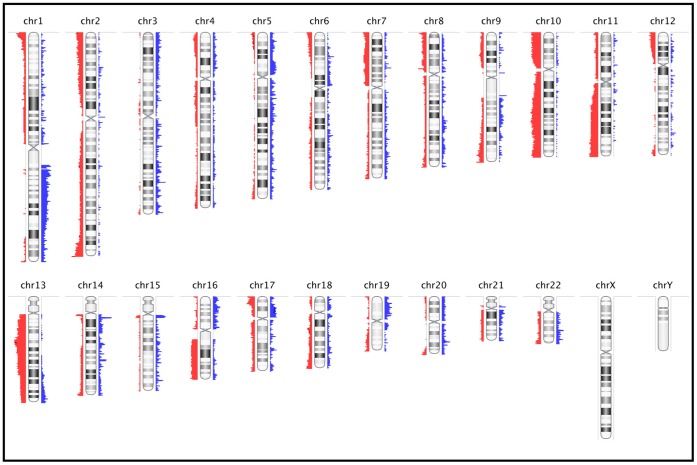
Figure 5. Frequency Plot of Common Genomic Copy Number Aberrations among 22 FFPE Leiomyosarcomas.
Commonly aberrant regions are plotted as a function of their chromosomal position. Red bars to the left of the chromosome represent frequency of deletions and blue bars to the right of the chromosome represent amplifications. The heights of the bars correspond to the relative frequency of aberrations among the cases. All CNAs are detected using the FASST2 algorithm.

