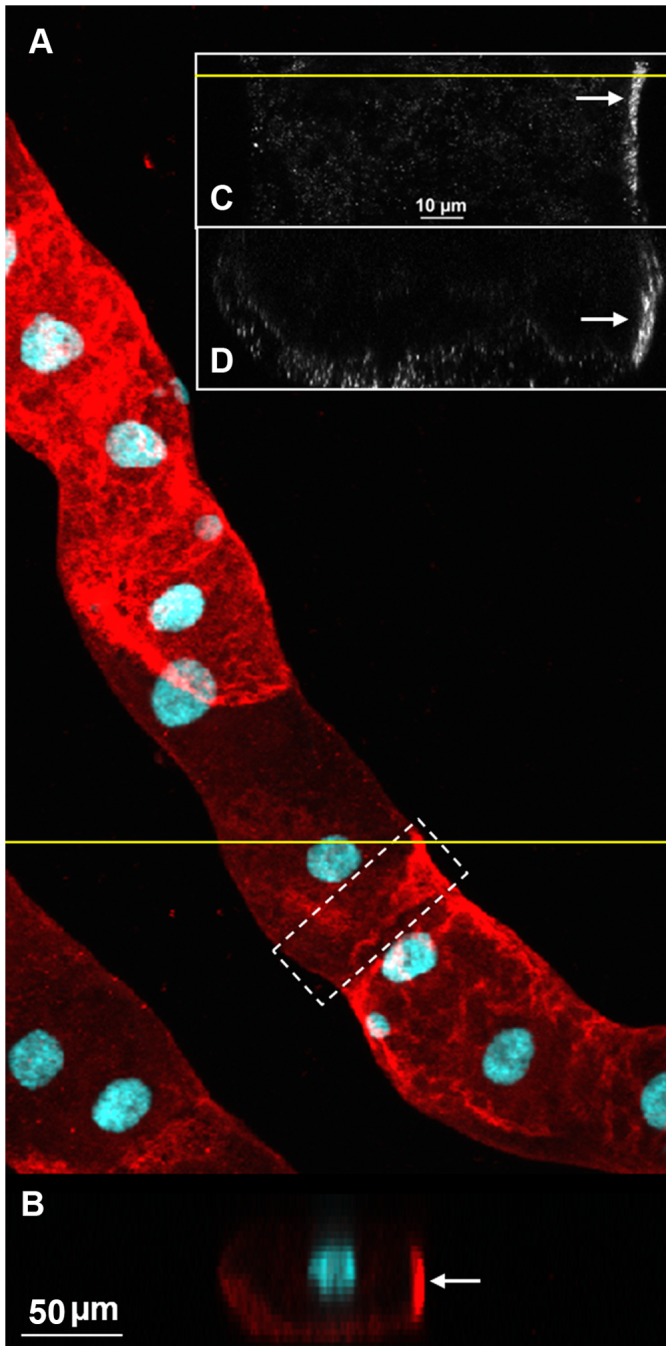
Figure 2. Expression of AaegGPRCAL1 in the basolateral membrane of principal cell (PC).

(A) Expression of AaegGPRCAL1 in principal cells (maximum intensity of projection for a confocal Z-stack; 23 optical sections, Z-step 3.6 µm). (B) XZ section of the stack at the position indicated by the yellow line in (A). It shows the PC nucleus near the PC apical membrane and receptor signal consistent with the location of the basolateral membrane. A particular section of a PC near the distal tubule (dashed white rectangle in A) was chosen for further analyses in C and D. (C–D) Higher resolution images acquired using a 100X/1.4 oil immersion objective from the white dashed-box area in (A). (C) A single optical XY section located 10.12 µm from the basolateral membrane. (D) XZ view of the Z-stack (86 images, Z-step 0.44 µm) at a position indicated by the yellow line in (C). AaegGPRCAL1 signal in the basolateral membrane region of the PC is indicated with white arrows (B–D).
