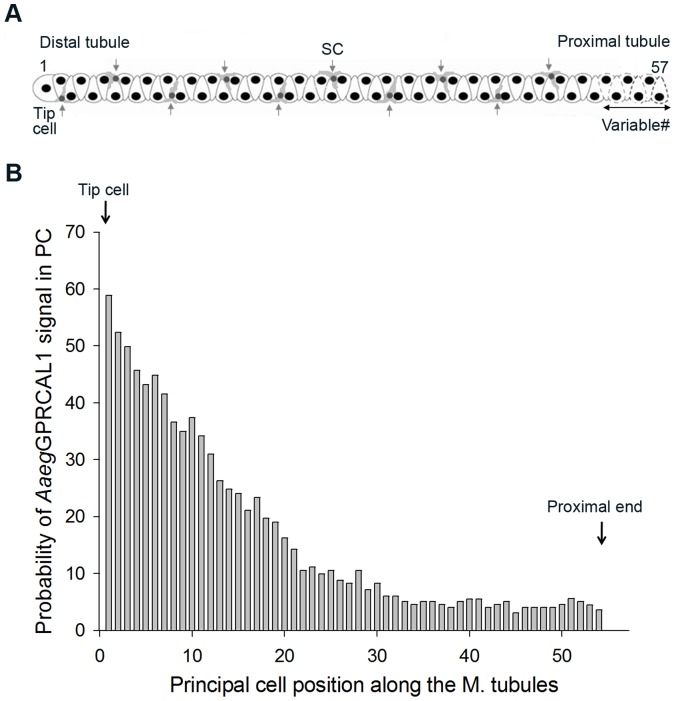
Figure 3. AaegGPRCAL1 signal in principal cells (PCs) is distributed in a gradient-like fashion along the MTs.
(A) MT schematic indicating the position of PCs from the tip cell (number 1) to the last proximal cell (variable from number 51 to 57 in individual mosquitoes, dashed cells). The average number of PC (54) and stellate cells (10) per tubule was obtained from MTs analyzed by immunohistochemistry. (B) Receptor signal was only observed up to cell number 54 (♀N = 42). Plot of probability of receptor signal versus cell position was created by the following equation. Probability (P) = exp (0.5126-0.1371*Pos.-0.001255*Pos.*Pos.)/(1+exp(0.5126-0.1371*Pos.-0.001255*Pos.*Pos.).

