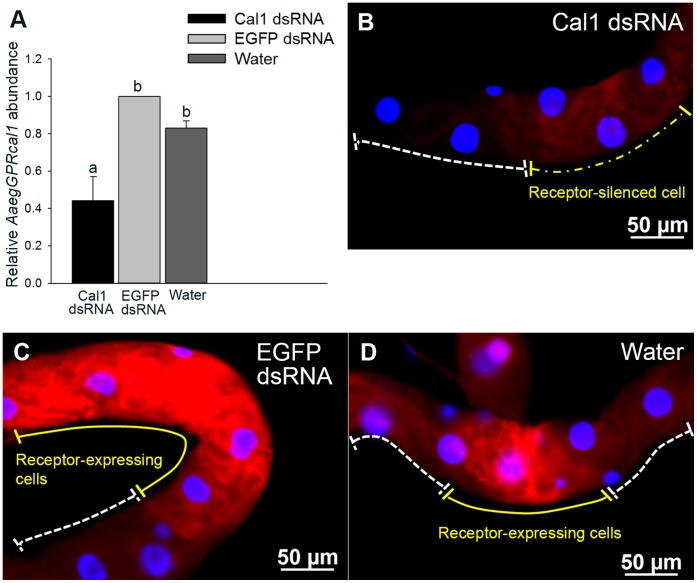
Figure 4. RNAi effect on AaegGPRcal1 transcript and AaegGPRCAL1 expression in principal cells of female MTs.
(A) Relative quantification of AaegGPRcal1 transcript in the MTs five days after injection with AaegGPRcal1 dsRNA, EGFP dsRNA or water. Bars represent mean ± S.D.; 1 indicates the calibrator. Data were analyzed by ANOVA followed by Tukey multiple comparison test (common letter indicates not significantly different at 0.05 level). (B–D) Fluorescence microscopy analyses; images were obtained with the same exposure time (200 msec). Females injected with AaegGPRcal1 dsRNA exhibited lower AaegGPRCAL1 fluorescent signal intensity (B, yellow dashed line) by a factor of 3 than those injected with EGFP dsRNA (C, yellow solid line) or water (D, yellow solid line).

