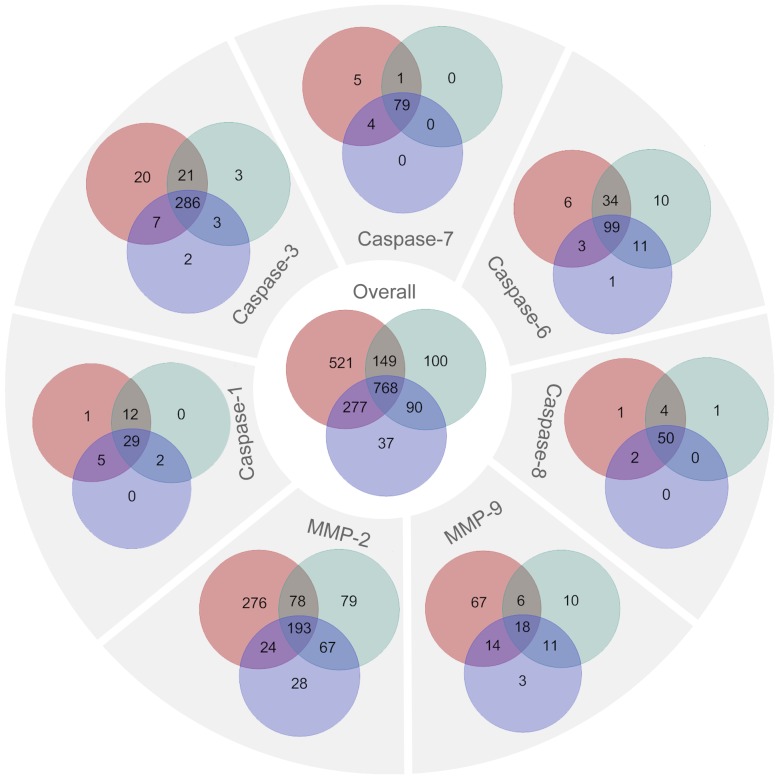
Figure 8. Venn diagrams showing the prediction consistency between PROSPER, PoPS and SitePrediction.
The different colored circles denote different prediction tools: PROSPER, red; PoPS, blue; SitePrediction, green. The sum of the numbers in each color represents the number of known cleavage sites that were correctly predicted by the tool. The number in each overlapping region represents the number of known cleavage sites that were correctly predicted by two or all tools. For example, for MMP-2, 276 sites were correctly predicted by PROSPER and by no other tool, 78 were correctly predicted by PROSPER and SitePrediction, 24 by PROSPER and PoPS and 193 by all three tools. The number in the inner circle “Overall” represents the total number of correctly predicted known cleavage sites by the corresponding tool.

