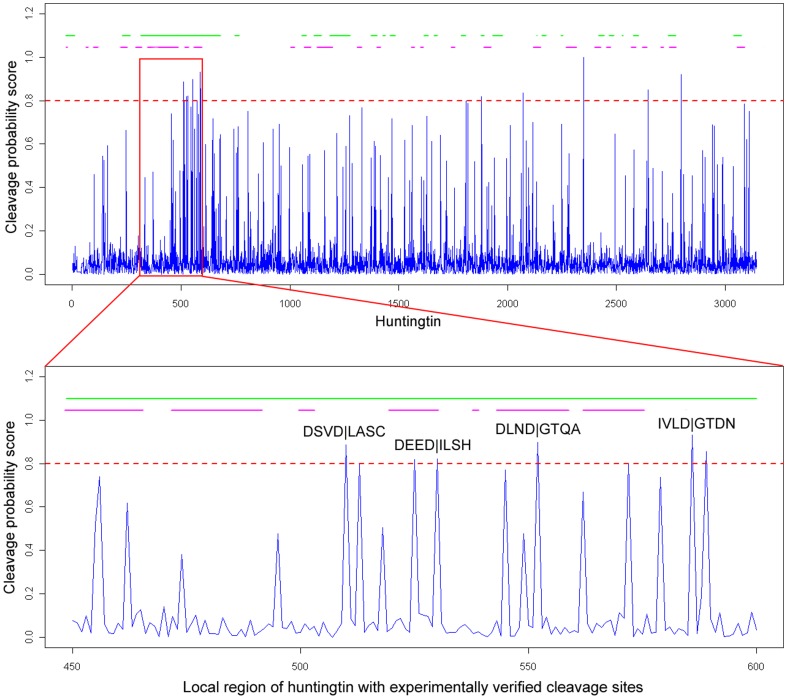
Figure 10. Full-length sequence scanning of huntingtin protein by PROSPER for caspase-3 cleavage sites, with the zoomed-in view of the region flanking experimentally verified cleavage sites of huntingtin.
The horizontal axis represents the amino acid position; the vertical axis represents the cleavage probability score generated by PROSPER. The predicted solvent exposed and natively disordered regions on the top of each figure are highlighted by green and red, respectively. A higher threshold value of 0.8 for making the positive cleavage site prediction is denoted by a dashed red line. P4-P4′ sites of the experimentally verified cleavage sites are labeled.

