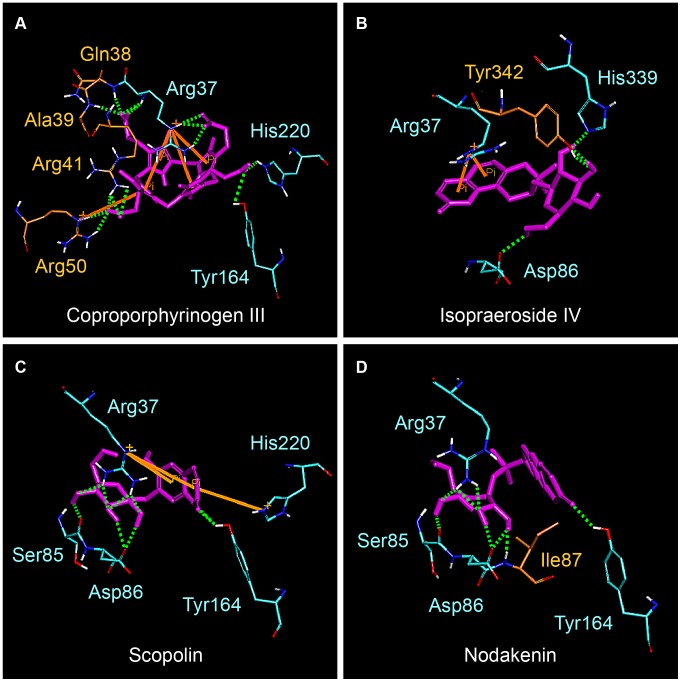
Figure 5. The average structure of docking poses with UROD during 38–40 ns MD.
(A) Coproporphyrinogen III (B) isopraeroside IV (C) scopolin (D) nodakenin. Orange solid lines and green dashed lines represent pi-pi interactions and hydrogen bond interactions, respectively. Only polar hydrogens were shown within the illustrations for clarity.

