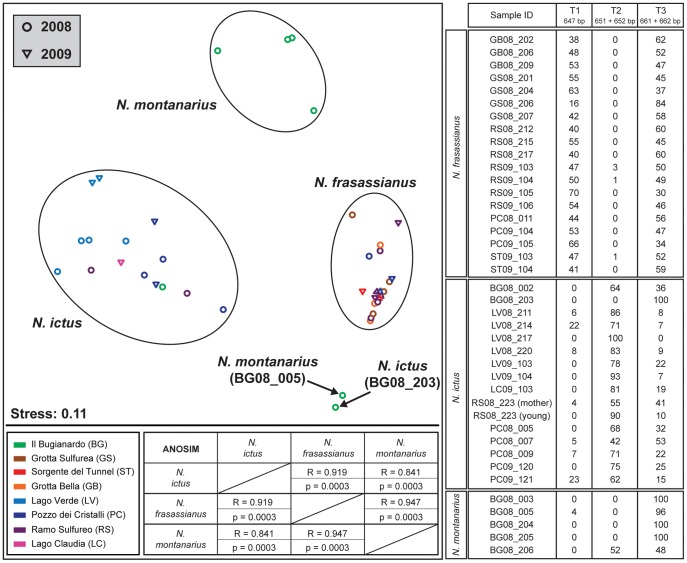
Figure 4. Graphical and tabular presentation of ARISA results.
Left: Non-metric multidimensional scaling (NMDS) plot, in which each data point represents the Thiothrix ectosymbiont community structure associated with one Niphargus individual. Circles represent samples collected in May–June 2008 and triangles those collected in May–June 2009 from one of the eight Frasassi cave locations represented by different colors. Pairwise similarities among the Thiothrix ectosymbionts of N. frasassianus, N. ictus, and N. montanarius show that their community structures on the three host species are clearly distinct (overall ANOSIM R value: 0.894, overall Bonferroni-corrected p-value: 0.0001). Right: The table shows relative proportions (% among each other) of OTUs assigned to Thiothrix symbionts T1–T3 in ARISA consensus profiles of Niphargus-associated epibiont communities. Sample IDs indicate the sampling location and year (GB = Grotta Bella, GS = Grotta Sulfurea, RS = Ramo Sulfureo, PC = Pozzo dei Cristalli, ST = Sorgente del Tunnel, BG = Il Bugianardo, LV = Lago Verde, LC = Lago Claudia; for example, GB08_202 indicates that the sample with internal number 202 was collected from cave location GB in 2008).

