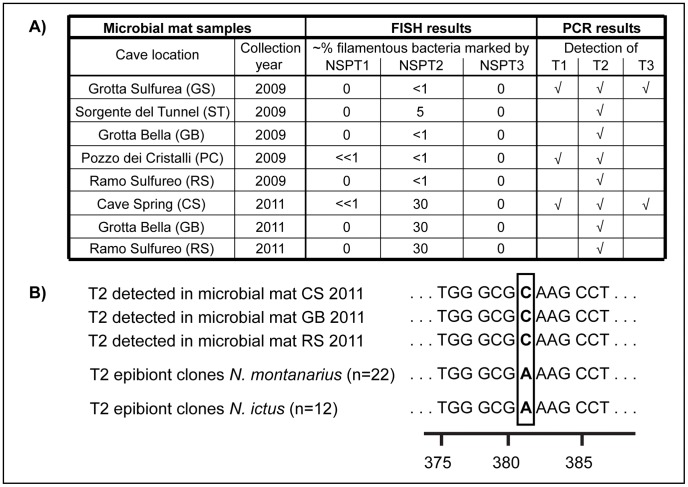
Figure 5. Results of FISH and PCR analyses of Frasassi microbial mats.
(A) NSPT1–NSPT3 = Niphargus Symbiont Probes specific to T1–T3. √ = PCR product of expected size verified by sequencing to belong to clades T1, T2, or T3. (B) Consistent one-base difference between T2 16S rDNA sequences derived from microbial mats and Niphargus samples. n = number of clones. Numbers below the sequences refer to 16S rRNA nucleotide positions according to Escherichia coli numbering [57]. Microbial mat T2 sequences were obtained by sequencing PCR products using T2-specific primers, whereas T2 epibiont sequences were obtained from 16S rDNA clone libraries of Niphargus.

