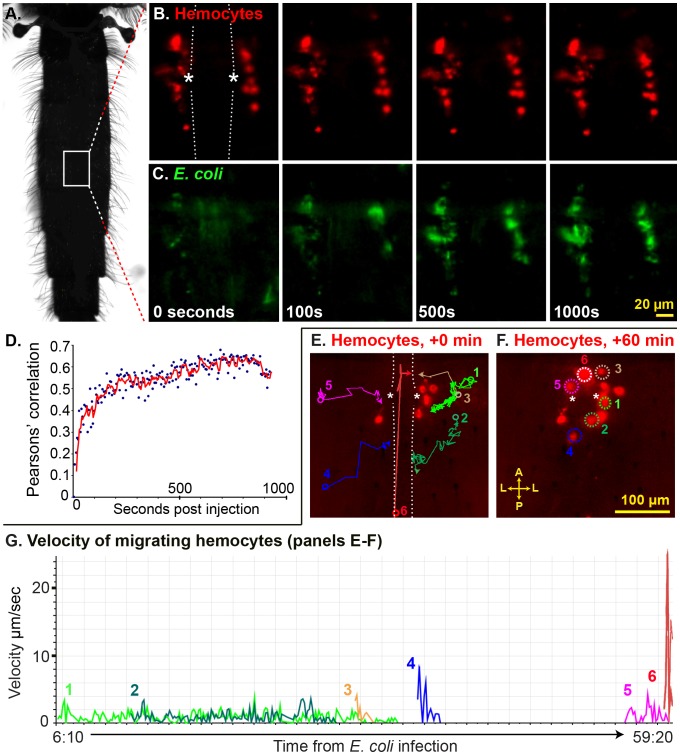
Figure 5. Periostial hemocytes rapidly phagocytose pathogens and infection induces the recruitment of additional periostial hemocytes.
(A) Top-down view of a mosquito, outlining the region observed in panels B, C, E and F. (B–C) Time-lapse images of a periostial region of a mosquito whose hemocytes had been labeled with CM-DiI prior to infection (Movie S1). The heart is outlined by dotted lines and the asterisks denote the ostia. During the first 1,000 sec post-infection with E. coli little hemocyte (red) movement is observed (B), but phagocytosis of E. coli (green) by resident periostial hemocytes begins within seconds of infection (C). (D) Pearson's correlation coefficient analysis of Movie S1 (B–C), quantitatively showing the rapid co-localization of hemocytes and E. coli. (E–F) Time-lapse images showing the migration of hemocytes (red) to the periostial regions during the first hour post-infection with E. coli (Movie S2). At the time of infection, 6 CM-DiI stained hemocytes flank the heart (E), and during the first hour of infection at least 6 additional hemocytes attach at the periostial region (F; dotted circles). The movement of each migrating hemocyte is shown in panel E using colored lines, with the circles marking the points of first observance and the arrows marking the points of attachment. (G) Velocity and acceleration of the hemocytes tracked in panels E and F as they migrate to the periostial regions (Movie S2), showing that hemocytes glide across the alary muscles at a median velocity of 1.2 µm/sec. A, anterior; P, posterior; L, lateral.

