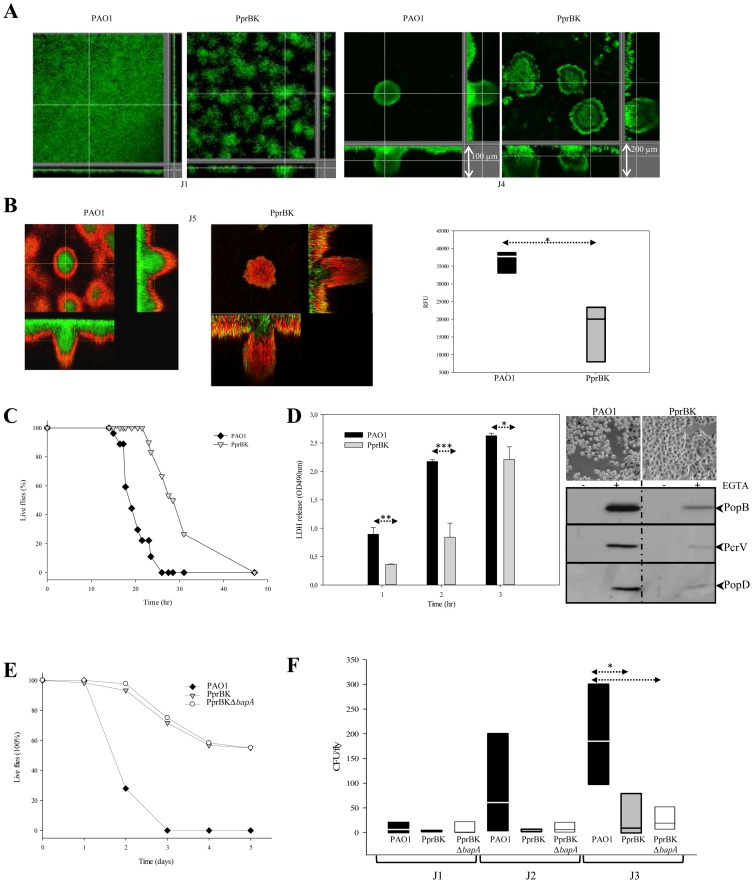
Figure 3. PprB-dependent phenotypes.
Biofilm formation monitored at day 1 (J1) and 4 (J4) of PAO1GFP and PprBKGFP strains (A). Antimicrobial tolerance of PAO1 GFP and PprBKGFP -5day aged biofilms exposed to 20 µg/ml of tobramycin for 24 hr (B). Dead cells were labeled with propidium iodide. Extracted z images and their respective xy and xz planes are presented. Resazurin viability test was performed in PAO1 and PprBK biofilms formed in microplates and exposed to 20 µg/ml of tobramycin for 24 hr. Relative fluorescence (RFU) was measured using λexc and λem of 530 nm and 595 nm, respectively. Independent measurements were submitted to a one way statistical test (*:<0.05). PprBK strain virulence was examined in D. melanogaster model (C) using fast killing assay and compared to PAO1. Survival curves (% of live flies according to time of infection) were drawn and each point represents a total of 30 flies displayed in 3 different vials by group of 10. One representative experiment out of three is shown. PprBK strain virulence (D) was tested in the HeLa cell model (right and upper panel) and compared to the PAO1 strain. Rounding of cells was surveyed under optical microscopic observation. Cytotoxicity of PAO1 and PprBK strains towards J774 murine macrophages was evaluated by LDH release measured at OD490 (Left panel). Statistical differences were evaluated using a t-test (*:<0.05, **:<0.0.01, ***:<0.001). In vitro secretion of T3SS proteins forming the translocon (PopB, PopD and PcrV) was checked with (+) or without (−) inducing conditions (EGTA) in PprBK and PAO1 strains (right and lower panel). Bacterial virulence was checked in D. melanogaster oral infection assay (E) for PprBK, PprBKΔbapA and PAO1 strains. Survival curves (% of live flies according to time of infection) were drawn and each point represents a total of 60 flies. One representative experiment out of three is shown. Dissemination of bacteria from the gut lumen toward the hemolymph compartment (F) was evaluated for PprBK, PprBKΔbapA and PAO1 strains by counting CFU in hemolymph collected and pooled from 10 infected Drosophila per strain. Box plots represent the data obtained on 3 independent experiments made for each strain. Statistical differences were evaluated using a Kruskal-Wallis One Way Analysis (*:<0.05).

