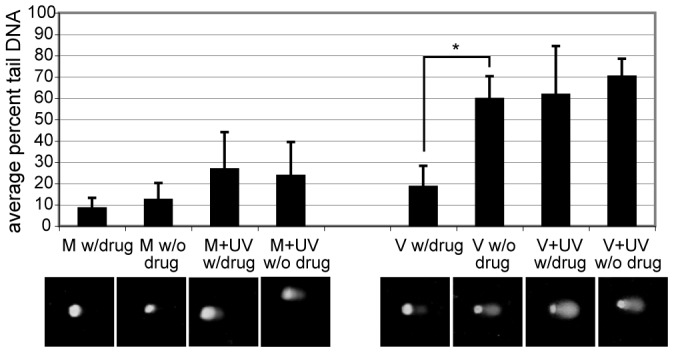
Figure 3. V alone tails were due to viral replication.

Cells were treated as described in Figure 2 for comet analysis. Two parallel sets were prepared. One set received 45 µM ganciclovir continuously after 24 hpi. Cells were harvested at 24 h post irradiation for analysis. An * denotes a statistical significance of p<0.0001 between samples as measured by unpaired t-test. Below each category is an example of the comets observed for the given treatment.
