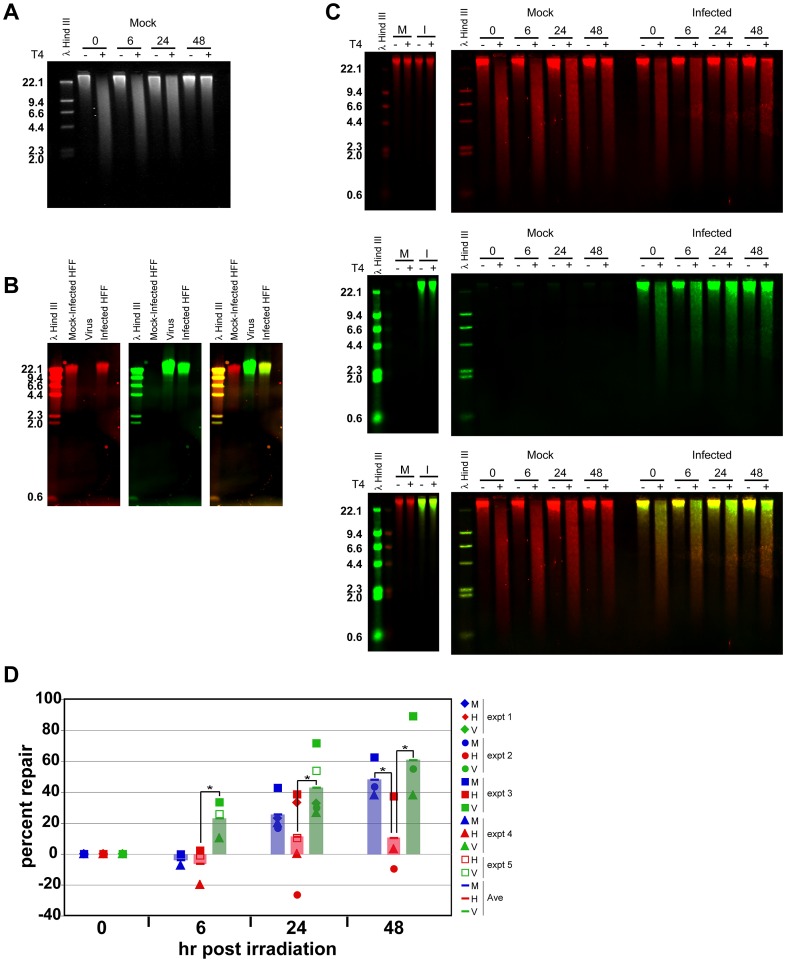
Figure 7. Dual color T4 assays revealed faster and more substantial repair of CPDs in viral DNA of infected cells.
A) Mock-infected cells were irradiated with 50 J/m2 UV at 48 hpi and cells were collected at the indicated times post-irradiation for T4 assay analysis as described in Materials and Methods. Following T4 digestion, fragments were separated on an alkaline agarose gel, which was subsequently stained with SYBR Gold. Sizes of marker fragments are labeled in Kb in all images. B) DNA from mock-infected cells, pelleted virions and virus-infected cells were electrophoresed on a native agarose gel and transferred to nylon membrane. The blot was probed with digoxigenin –dUTP labeled host genomic probes (red - left panel) and biotin-dUTP labeled virus genomic probes (green- middle panel). An overlay image of red and green channels is shown at the right. Yellow indicates the presence of both viral and cellular DNA. Blots in B and C were visualized on a Li-Cor Odyssey scanner. C) HCMV-infected and mock-infected cells were irradiated (right panels) with 50 J/m2 UV or unirradiated (left panels) at 48 hpi. Cells were collected at the indicated times post-irradiation for T4 assay analysis as described in Materials and Methods. Following T4 digestion, fragments were separated on an alkaline agarose gel and transferred to nylon membrane. The blot was probed simultaneously with digoxigenin –dUTP labeled host genomic probes (red - top panel) and biotin-dUTP labeled virus genomic probes (green - middle panel). An overlay image of red and green channels is shown in the bottom panel. Unirradiated panels show only 48 hp irradiation samples. D) Percent repair in mock-infected (blue) and virus-infected cellular DNA (red) and viral DNA (green) was quantitated as described in Bespolov et al [59]. The results from five separate experiments are represented as different symbols on the graph. Bars represent the average of these experiments for ease of viewing. Asterisks represent statistically significant differences using paired t-tests for host versus viral DNA repair (p<0.001, p<0.01, p<0.01, for timepoints 6,24 and 48, respectively) and for host versus mock DNA repair (p<0.02 at 48 hp irradiation). M = mock DNA, H = host DNA, V = virus DNA.

