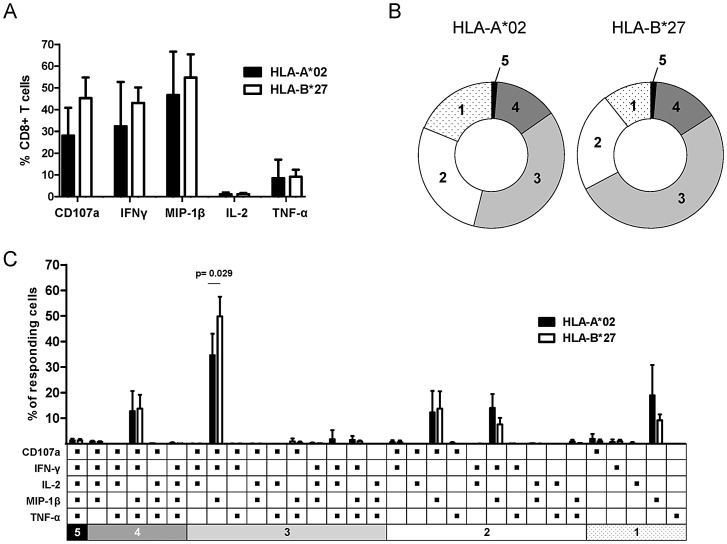
Figure 2. Functional profile of HCV-specific CD8+ T cells.
(A) Cytokine production and CD107a mobilization of CTL lines, derived from chronically HCV infected subjects specific for HLA-A*02-restricted epitopes (n = 4, black bars) and the immunodominant HLA-B*27-restricted epitope NS5B2841 (n = 4, white bars). Prior to intracellular multi-cytokine staining CTL lines were stimulated for 5 hours with specific peptides. The background value from the negative control (without peptide) was subtracted from all measured response frequencies (cytokine+ CD8+/total CD8+). Data are presented as mean ± SD. (B) Pie charts showing the mean multifunctionality of HLA-A*02-restricted (n = 4) and HLA-B*27-restricted (n = 4) HCV-specific CD8+ T-cell lines (one to five functions: CD107a, IFN-γ, IL-2, MIP-1β and TNF-α). Responding cells are grouped by the number of functions indicated by the numbers in the pie charts and matched to the color code in figure 2C. (C) Detailed functional profile of HLA-A*02-restricted (n = 4, black bars) and HLA- B*27-restricted (n = 4, white bars) HCV-specific CD8+ T-cell lines. Bars represent frequency of CD8+ T cells displaying the indicated combination of functions within the total population of responding CD8+ T cells. P-values were calculated using the Mann-Whitney U-test. Data are presented as mean ± SD.

