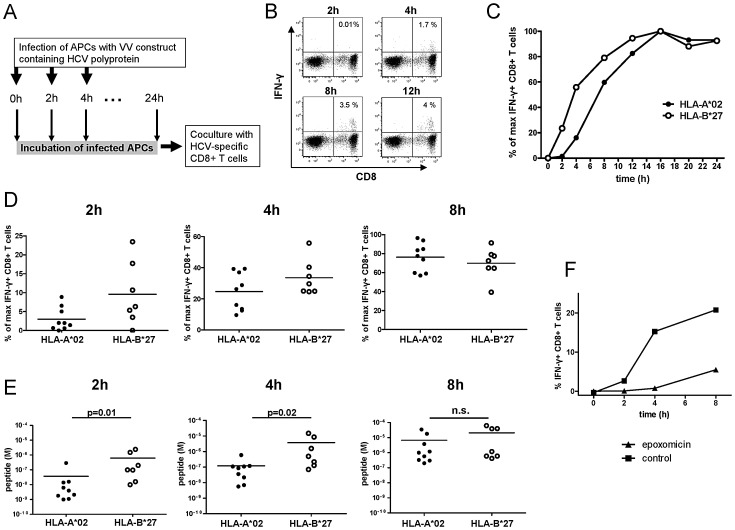
Figure 8. Processing and presentation of HCV-specific CD8+ T-cell epitopes.
(A) APCs were infected with vaccinia virus constructs carrying the relevant part of the HCV polyprotein (vHCV 827). After a defined time period (0, 2, 4, 8, 12, 16, 20 and 24 hours) these APCs were added to HCV-specific CTL lines and antigen-specific IFN-γ production was assessed by flow cytometry. (B) Representative flow cytometry plots of a CTL line stimulated with infected APCs. Prior to intracellular IFN-γ staining, the epitope-specific CTL line was stimulated for 5 hours with APCs previously infected with vHCV 827 and pre-incubated for 2, 4, 8 and 12 hours respectively. The background value from the negative control (T7 RNA polymerase (vTF7)) was subtracted from all measured response frequencies (IFN-γ+ CD8+/total CD8+). (C) Representative time course showing intracellular IFN-γ staining of an HLA-A*02-restricted CTL line (filled circles) and an HLA-B*27-restricted (open circles) CTL line stimulated with infected APCs pre-incubated for 0 to 24 hours. The background value from the negative control (vTF7) was subtracted from all measured response frequencies (IFN-γ+ CD8+/total CD8+), which were then normalized to the maximum response by defining the smallest value as 0% and the largest value as 100%. The complete kinetic (0 to 24 hours) was performed for all subjects, and the normalized responses were used to generate the data shown in Figure 8D and E. (D) Responses of CTL lines against APCs infected with vHCV 827 and pre-incubated for 2, 4 and 8 hours. Normalized IFN-γ responses of CTL lines specific for HLA-A*02-restricted epitopes (n = 9, filled circles) and for the immunodominant HLA-B*27-restricted NS5B2841 epitope (n = 7, open circles) are shown. Responses were normalized to the maximum response, as described for Figure 8C. Horizontal bars represent mean values. (E) Calculated peptide concentration present at the surface of infected APCs after 2, 4 and 8 hours of incubation with vHCV 827. The concentration of presented peptide restricted by HLA-A*02 (n = 9, filled circles; Table 1) and HLA-B*27 (NS5B2841; n = 7, open circles) was calculated by correcting for the individual functional avidity of the respective peptide-specific CTL line. For details of the calculations, see Figure S3. P-values were calculated using the Mann-Whitney U-test. Horizontal bars represent mean values. (F) Representative time course showing intracellular IFN-γ staining of an HLA-B*27-restricted CTL line stimulated with infected APCs incubated for 0 to 8 hours and pre-incubated with (triangles) or without (squares) the proteasome inhibitor epoxomicin. The background value from the negative control (vTF7) was subtracted from all measured response frequencies (IFN-γ+ CD8+/total CD8+). Data are representative of experiments performed with two different HLA-B*27-restricted CTL lines and one HLA-A*02-restricted CTL line.

