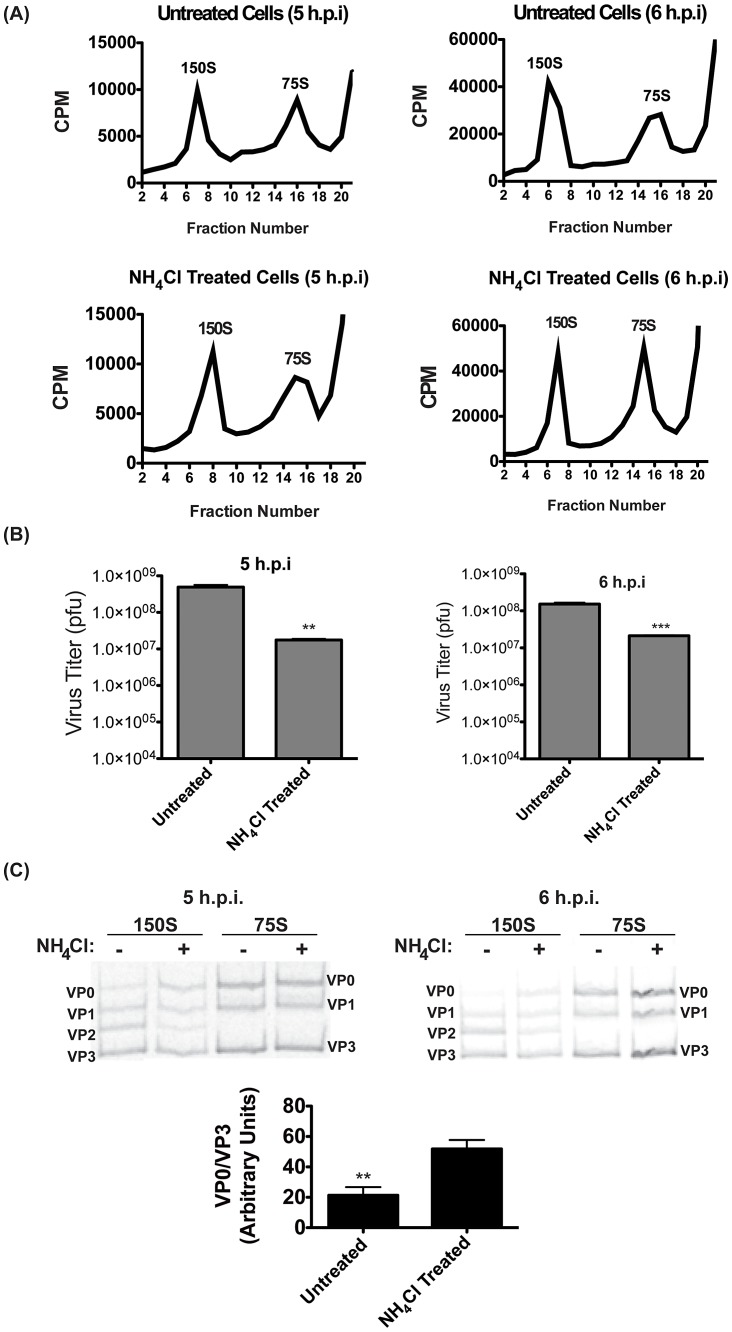
Figure 6. Virion maturation requires acidic compartments.
(A) H1-Hela cells were infected at an MOI of 50 pfu/cell, and half of the samples were treated with NH4Cl. Cells were labeled with 35S-Methionine from 3 h.p.i. until collection at 5 or 6 h.p.i., and lysates were then separated on a 15–30% sucrose gradients. Fractions were then collected and the counts per minute (CPM) were analyzed for each fraction. Representative gradients from three independent experiments are shown. (B) The three fractions representing the 150S peak in each experiment were pooled for plaque assay analysis. Data shown are the averages from three independent experiments. (C) Three fractions representing the 150S and 75S peaks were pooled and run on SDS-PAGE, and the 35S-Methionine labeled bands were visualized. The bands are labeled according to expected relative migration pattern, and VP2 is identified by its absence in the 75S peak. The ratio of VP0 to VP3 bands was analyzed from four independent experiments and plotted in arbitrary units. * p<0.05, ** p<0.01, *** p<0.0001.

