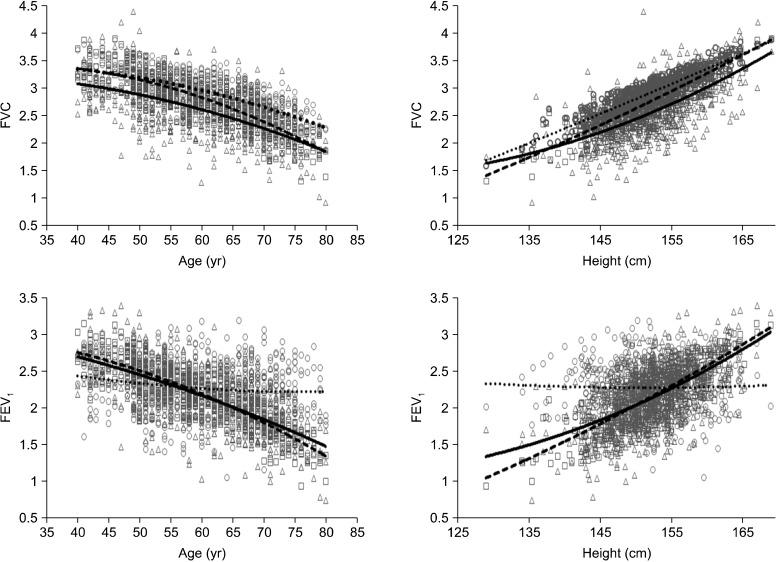
Figure 3.
Scatter diagrams for FVC and FEV1 values measured (△), estimated using the Korean regression model (◯) and estimated using the USA Caucasian regression model (□) in female subjects. Trend line ― is for measured values, ...... for estimated values using the Korean regression models, and ---- for estimated values using the USA Caucasian regression models, respectively. FVC: forced vital capacity; FEV1: forced expiratory volume in one second.

