
Table 1.
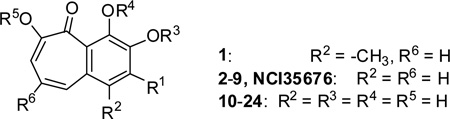
Structure-activity relationship analysis of the benzotropolone analogs in inhibition of NO production in RAW 264.7 cells.
 | ||||||
|---|---|---|---|---|---|---|
| Compound | R1 | R3 | R4 | R5 | IC50 (µM)[a] | |
| NCI35676 | OH | H | H | H | 2.45± 0.25 | |
| 1 | H | H | H | H | 3.13± 0.11 | |
| 2 | H | H | H | H | 2.25± 0.31 | |
| 3 | F | H | H | H | 22.7± 1.4 | |
| 4 | OCH3 | H | H | H | 4.83± 0.25 | |
| 5 | OCH3 | CH3 | H | CH3 | 11.7± 1.1 | |
| 6 | OCH3 | CH3 | CH3 | CH3 | 39.9± 0.9 | |
| 7 | OCOCH3 | H | H | H | 4.83± 0.25 | |
| 8 | OCOCH3 | COCH3 | H | COCH3 | 1.42± 0.21 | |
| 9 | OCOCH3 | COCH3 | COCH3 | COCH3 | 2.35± 0.41 | |
| R1 | R6 | |||||
| 10 | OCH3 | COOH | 21.5± 0.4 | |||
| 11 | OCH3 | COOCH3 | 3.11± 0.75 | |||
| 12 | H | COOH | 16.5± 0.8 | |||
| 13 | H | COOCH3 | 9.01± 0.50 | |||
| 14 | OCH3 | COOCH2CH3 | 2.83± 0.44 | |||
| 15 | OCH3 | COOCH(CH3)2 | 2.47± 0.71 | |||
| 16 | OCH3 | COO(CH2)3CH3 | 2.83± 0.44 | |||
| 17 | OCH3 | COO(CH2)7CH3 | 0.72± 0.14 | |||
| 18 | OCH3 | COO(CH2)9CH3 | 1.01± 0.10 | |||
| 19 | OCH3 | COO(CH2)13CH3 | 3.24± 0.13 | |||
| 20 | OCH3 | CONH(CH2)3CH3 | 1.26± 0.31 | |||
| 21 | OCH3 | CONH(CH2)5CH3 | 1.36± 0.21 | |||
| CU-CPT22 | OCH3 | COO(CH2)5CH3 | 0.58± 0.09 | |||
| 23 | OCH3 | CH2OH | 4.11± 0.74 | |||
| 24 | OCH3 | CONH(o-toluene) | 1.36± 0.21 | |||
| 25 | 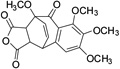 |
74.6± 2.9 | ||||
| 26 | 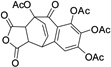 |
14.8± 0.5 | ||||
[a]
IC50 and corresponding SD values are determined from at least three independent repeats.