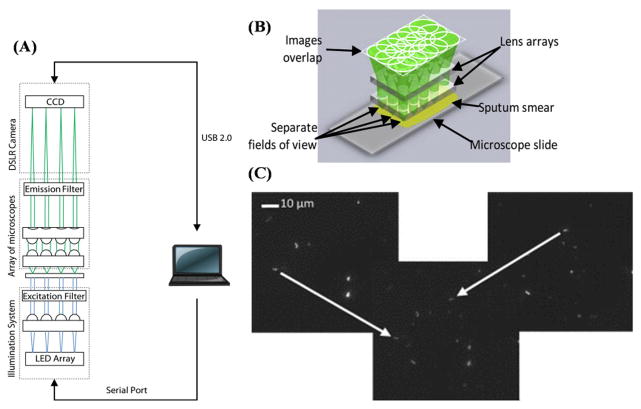
Figure 3.
(A) Schematic illustration of an integrated tuberculosis diagnosis platform.41 (B) Array microscope with separated, discontinuous fields of view. (C) Overlapping images of a positive sputum smear sample. Left and right digital images can be added numerically to form an overlapping image. Bacilli in the originally image can be seen in the overlapped image as indicated by the arrow. Reprinted from reference 41 with permission from Elsevier.

