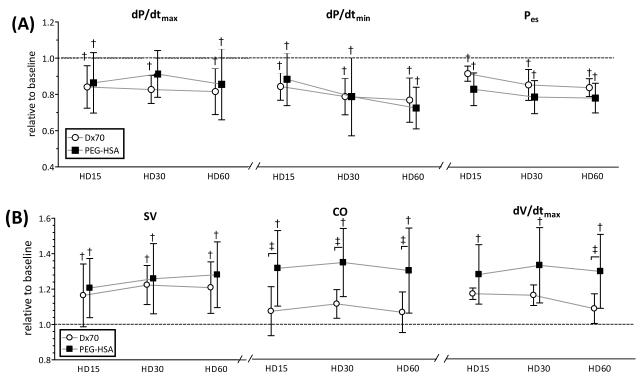
FIGURE 3.
Left ventricular cardiac function indices derived by PV conductance catheter at each time point after hemodilution. (A) indices related to left ventricular pressure and (B) indices related to left ventricular volume. Broken lines represent the values at baseline. Values are presented as means ± SD. †, P<0.05 compared with baseline; ‡, P<0.05 between groups. dP/dtmax; maximum rate of pressure change, dP/dtmin; minimum rate of pressure change, Pes; end systolic pressure, SV; stroke volume, CO; cardiac output, dV/dtmax; maximum filling volume rate. Data was collected at marked time points and artificially spaced for clarity in the plot.

