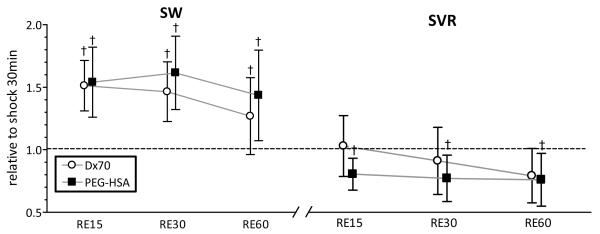
FIGURE 6.
Left ventricular stroke work (SW) and calculated systemic vascular resistance (SVR) from left ventricle pressure and volume, heart rate and blood pressure at each time point after resuscitation. Broken lines represent the values at shock (30 min after hemorrhage, SH30). Values are presented as means ± SD. †, P<0.05 compared to hypovolemic shock (SH30). Data was collected at marked time points and artificially spaced for clarity in the plot.

