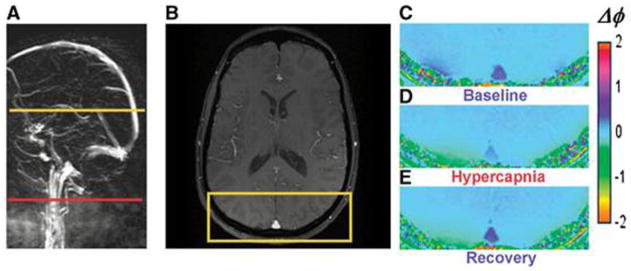
Figure 16.
(adapted from (91)). Images from which venous oxygen saturation during baseline, hypercapnia, and recovery were derived. (A) Sagittal localizer angiogram indicating the locations of SSS; (B) axial magnitude image; (C–E) GRE phase-difference images. Note the change in contrast in vessels during hypercapnia.

