Figure 2.
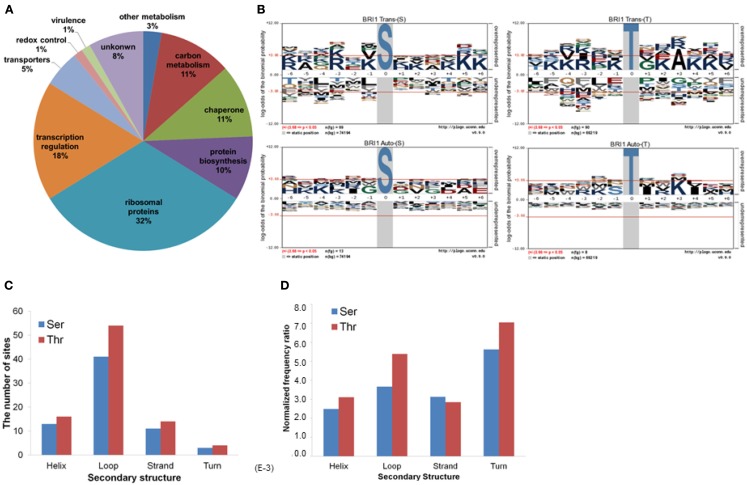
Characterization of BRI1 transphosphorylationsubstrates in E. coli. (A) The E. coli proteins phosphorylated by BRI1 in situ function in diverse biological pathways. (B) pLogo motif analysis of BRI1 transphosphorylation (upper panel) and autophosphorylation (lower panel) sites in E. coli separated according to serine and threonine sites. The number of sites analyzed is indicated in each panel. The phosphorylated residue is annotated as position 0, and the six upstream or downstream residues are annotated as −6 to −1 and +1 to +6, respectively. Residues above the x-axis are overrepresented, relative to their statistical significance in the context of the entire E. coli proteome, while residues below the x-axis are underrepresented. The red line corresponds to a p-value of 0.05. (C) The distribution of the BRI1 transphosphorylation sites in protein secondary structure. (D) The distribution of BRI1 transphosphorylation sites normalized for the total number of serine or threonine residues in a given secondary structure in the E. coli proteome.

