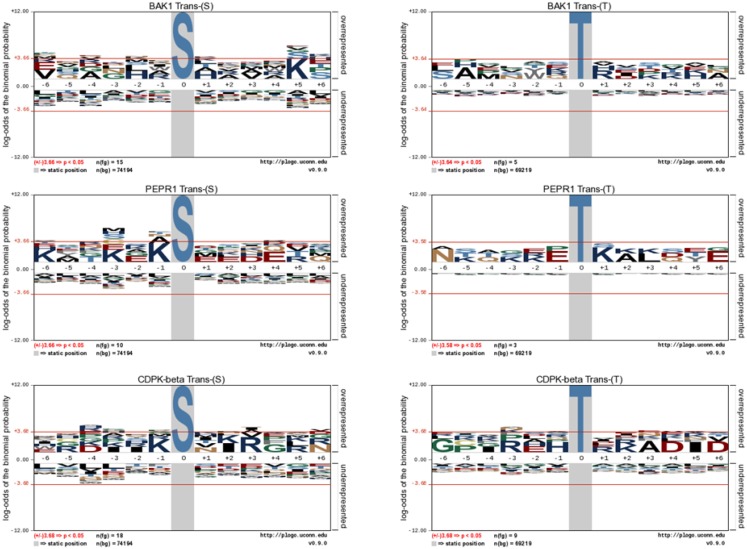
Figure 6.
Motif analysis for BAK1, PEPR1, and CDPKβ transphosphorylation of E. coli proteins. pLogo motif analysis of transphosphorylation on serine (left panels) and threonine (right panels) sites in E. coli. The number of sites analyzed is indicated in each panel. The phosphorylated residue is annotated as position 0, and the six upstream or downstream residues are annotated as −6 to −1 and +1 to +6, respectively. Residues above the x-axis are overrepresented, relative to their statistical significance in the context of the entire E. coli proteome, while residues below the x-axis are underrepresented. The red line corresponds to a p-value of 0.05.

