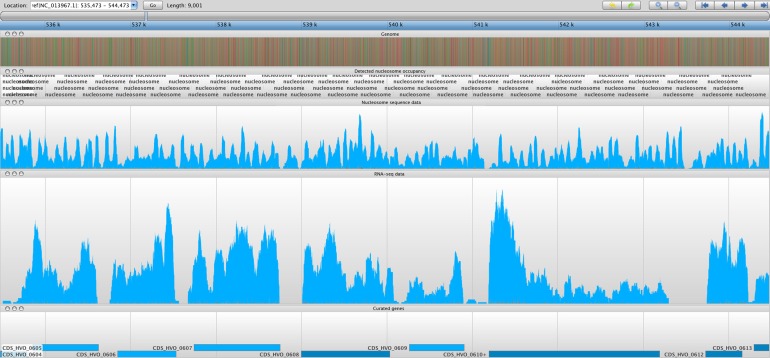
Figure 5. Sample screenshot of all data tracks loaded into the Savant genome browser (Fiume et al., 2010).
The nucleosome sequence data is displayed, and the periodicity reflects protected and unprotected fragments after MNase digestion (magnitude of peak is not considered). Peaks represent nucleosome midpoints, which were detected and marked. Below are the corresponding RNA-seq and curated gene tracks. In this screenshot, one can observe seven entire ORFs in line with their NDRs and –1 and +1 nucleosomes.

