Figure 8.
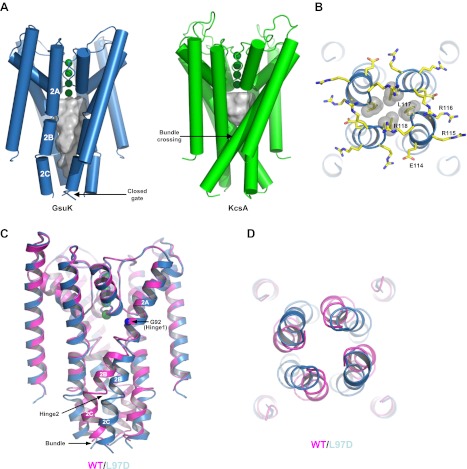
The ion conduction pore of GsuK. (A) Structural comparison between the GsuK pore and KcsA. K+ ions in the filter are shown as green spheres. Grey surface representation illustrates the space of the central cavity. GsuK inner helix (TM2) is segmented into three parts labeled as 2A, 2B and 2C, respectively. (B) Zoomed-in view of the GsuK intracellular gate with the surrounding charged residues drawn as sticks. Leu117 side chains are shown in CPK models. (C) Superimposition of the ion conduction pores from the wild-type (magenta) and the L97D mutant (blue) channels. (D) View of the superimposition from the intracellular side. The intracellular gate remains closed in the L97D mutant.

