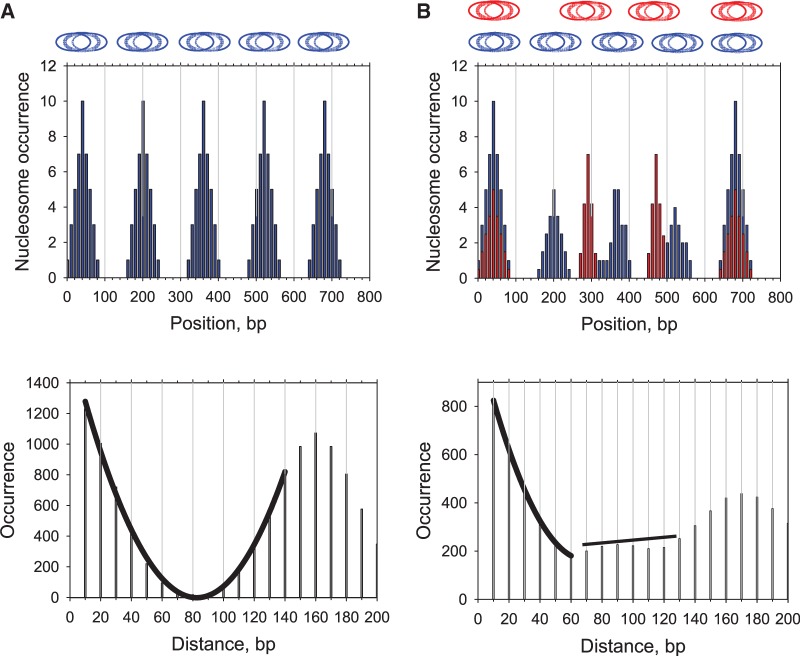
Figure 5.
Representative examples of the DAC function for cells in which nucleosomes are present in arrays with ‘normal’ spacing (160 bp) (A) and for a mixed population in which some cells have nucleosomes with 160 bp spacing on the gene (blue), and other cells have nucleosomes in arrays with longer spacing (180–250 bp in this example, shown in red) (B). The nucleosome occurrences at each nucleotide are presented as histograms. The corresponding DAC functions are plotted below, with the envelope curves passing through the peaks of the occurrence profiles.

