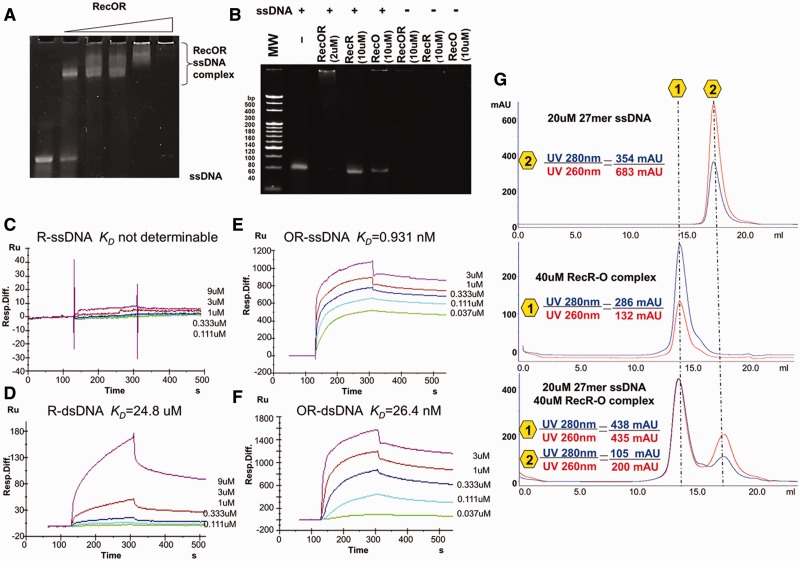
Figure 5.
The TTERecOR complex displays a clear preference for ssDNA. (A) Analysis of the interaction between 60 mer ssDNA (2 µM) and different concentrations of TTERecOR (Lines 1–6: 0, 1, 2, 4, 10 and 50 µM, respectively) by native PAGE. (B) Analysis of the interaction between 60 mer ssDNA (2 µM) and TTERecR (10 µM), TTERecO (10 µM) or TTERecOR (2 µM) by native PAGE. (C–F) BIAcore biosensor analyses of TTERecR or TTERecOR binding to immobilized 60 mer ssDNA or 60 mer dsDNA at 25°C. The apparent KD values were calculated from the kinetic KD (M) = Kd/Ka. (G) Size-exclusion chromatography analysis of the interaction between 27 mer ssDNA and TTERecOR.

