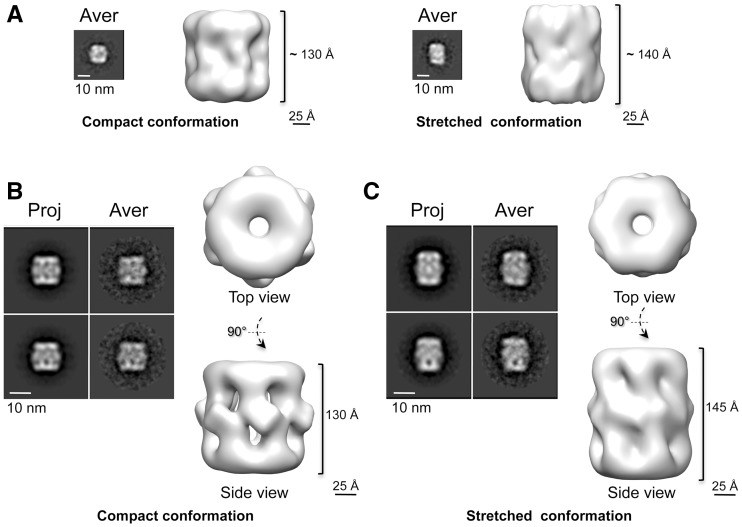
Figure 3.
Two conformations of the human RuvBL1–RuvBL2 complex. (A) RCT structures reveal two coexisting conformations. Each panel shows the average (Aver) of those particles that were used for the RCT reconstruction together with one side view of the RCT structure. (B) Negatively stained structure of the compact conformation. Two representative pairs of projection (Proj) and average (Aver) after angular refinement are shown. (C) Negatively stained structure of the stretched conformation. Two representative pairs of projection (Proj) and average (Aver) after angular refinement are shown. Scale bar, 10 nm.

