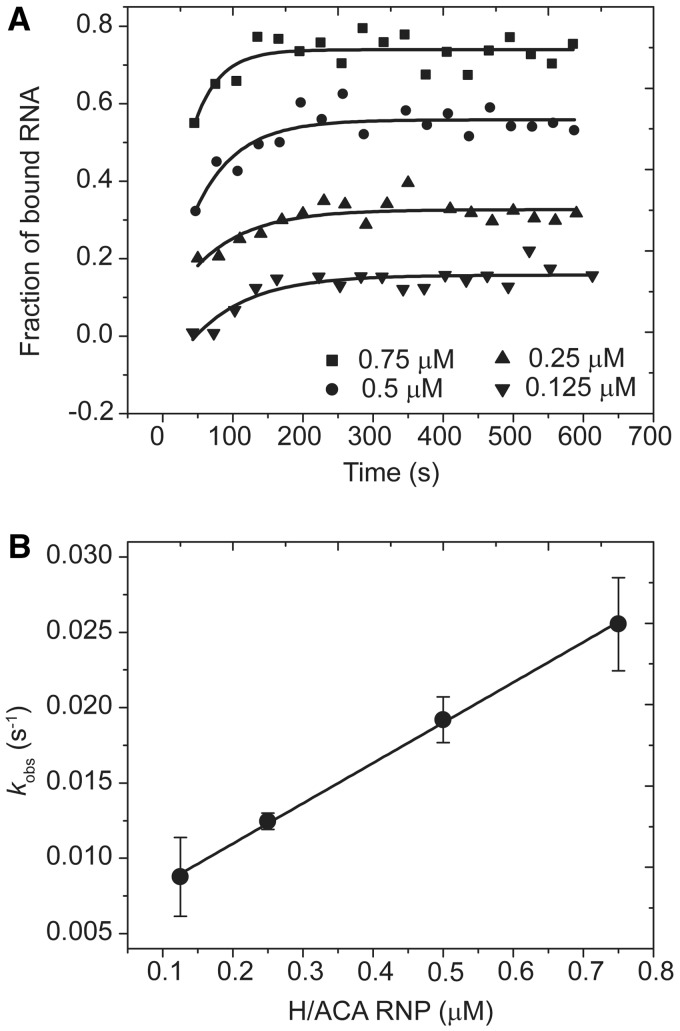
Figure 2.
Representative measurements of kinetic association rate. (A) The time course of association of Sub-U and WT-RNP. Sub-U (10 nM) was assembled with WT-RNP of 0.125, 0.25, 0.5 or 0.75 μM. FCS was measured over time and the fraction of bound RNA was derived. The curves are the best single-exponential fit, yielding apparent binding rates kobs. (B) The mean values and SD of kobs from two measurements are plotted as a function of H/ACA RNP concentration. The line is the best linear fit with the association rate (slope) kon = 0.0267 ± 0.0005 μM−1 s−1.

