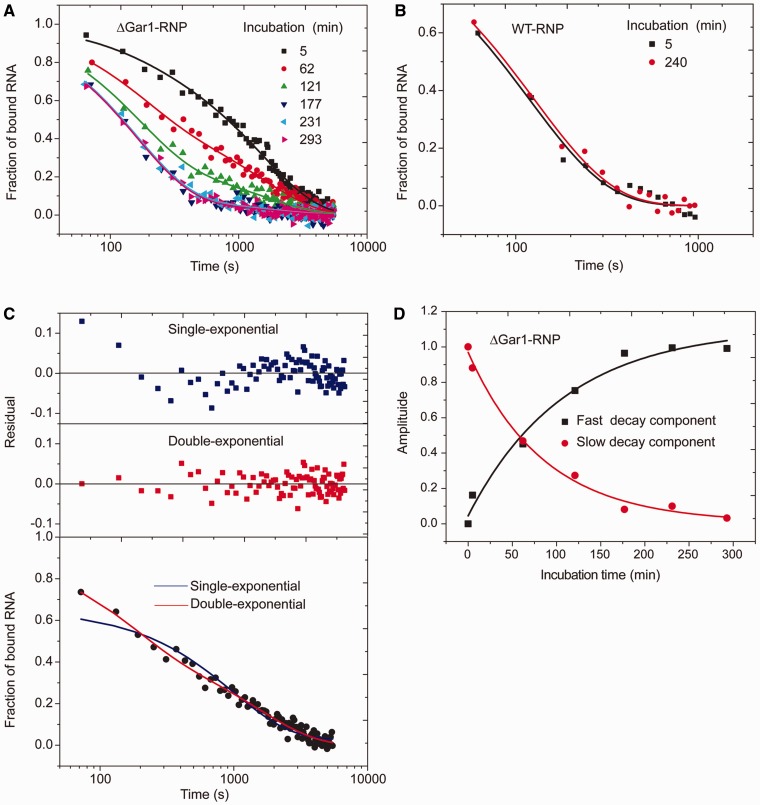
Figure 5.
Dissociation of substrate from reactive H/ACA RNPs. (A) Dissociation curves of the Sub-U/ΔGar1-RNP complex. After incubation of 5, 62, 121, 177, 231 and 293 min at 27°C, the mixture of Sub-U (2 µM) and ΔGar1-RNP (6 µM) was rapidly diluted by 4000-fold. The fractions of bound substrate and product RNAs are plotted against the dissociation time. The curves are the best global fit to a double-exponential function. (B) Dissociation curves of the Sub-U/WT-RNP complex. The reaction was incubated for 5 min or 4 h prior to dilution. Other experimental settings were the same as those in (A). (C) Comparison of single-exponential (blue line) versus double-exponential (red line) fitting of a dissociation curve of Sub-U with ΔGar1-RNP (T = 62 min). The fitting residuals of two models are shown on the top. (D) The amplitudes of fast (black square) and slow (red circle) decay components for dissociation of Sub-U/ΔGar1-RNP complex are plotted as a function of incubation time T. The lines are the best fit to a single-exponential decay.

