Figure 3.
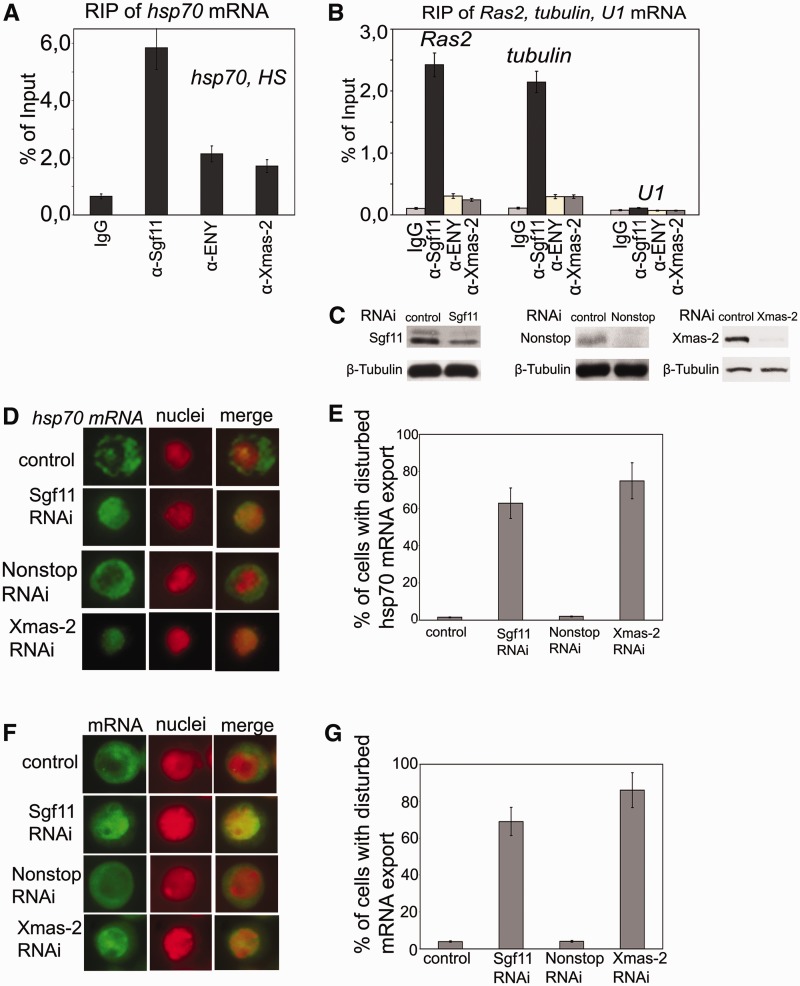
Sgf11 is associated with mRNAs of several genes, and its RNAi knockdown interferes with general mRNA export. (A) RIP experiments with hsp70 mRNA after heat shock were performed using antibodies against Sgf11 or components of the mRNA-interacting AMEX complex (ENY2, Xmas-2); nonimmune IgG was used as control. The results are shown as a percentage of input. (B) Sgf11 binds to mRNAs of Ras and tubulin genes under normal conditions. The U1 snRNA was used as a control. Antibodies used in RIP experiments were the same as in Figure 3 A. The results are shown as a percentage of input. (C) The level of Sgf11, Nonstop and Xmas-2 knockdown in experiments shown in Figures 3D–3G as estimated by western blot analysis in cells treated with GFP dsRNA (control) or dsRNA corresponding to Sgf11 and Nonstop. Tubulin was used as a loading control. (D) RNAi knockdown of Sgf11, but not Nonstop, interferes with hsp70 mRNA export after heat shock. Cells were treated with GFP dsRNA (control) or dsRNA corresponding to Sgf11 and Nonstop. Xmas-2 RNAi knockdown was performed as a positive control. Representative examples of the distribution of hsp70 mRNA (green staining) and cell nuclei (red staining) and corresponding merged images are shown for control cells and cells after Sgf11, Nonstop or Xmas-2 knockdown (magnification, ×1000). The hsp70 transcript was detected by RNA FISH using an Alexa 488-labeled probe; the nuclei were stained with DAPI. The images were recolored in Photoshop for better visualization. (E) Quantitative presentation of the results of experiments shown on Figure 3D. Bars show the percentage of cells with disturbed hsp70 mRNA nuclear export (about 200 cells per RNAi experiment were examined). (F) RNAi knockdown of Sgf11, but not Nonstop, interferes with general mRNA export. Cells were treated with GFP dsRNA (control) or dsRNA corresponding to Sgf11 and Nonstop. Xmas-2 RNAi knockdown was performed as a positive control. Representative examples of the distribution of mRNA (green staining) and cell nuclei (red staining) and corresponding merged images are shown for control cells and cells after Sgf11 or Nonstop knockdown (magnification, ×1000). RNA FISH was carried out using a Cy3-labeled oligo(dT) probe to identify poly(A) RNA. The nuclei were stained blue with DAPI. The images were recolored in Photoshop for better visualization. (G) Quantitative presentation of the results of experiments shown in Figure 3 F. Bars show the percentage of cells with disturbed hsp70 mRNA nuclear export (about 200 cells per RNAi experiment were examined).

