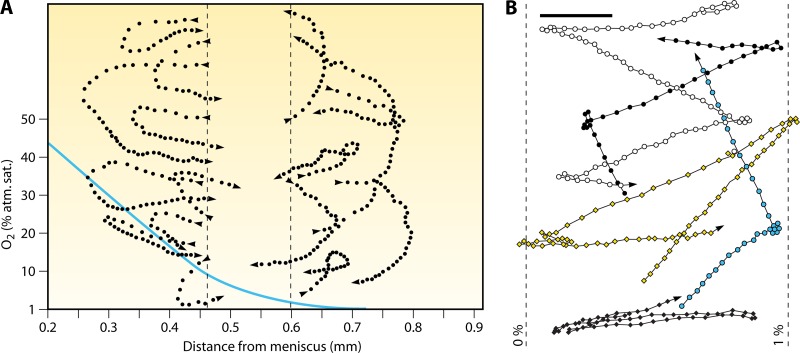
Fig 10.
Swimming trajectories of bacteria living at the sediment-water interface. (A) Swimming trajectories of Thiovulum majus in a plane (dotted lines), with the profile of oxygen concentration (solid line; values provided on the y axis) as a function of the distance from the meniscus overlaid. Cells display a strong behavioral response to changes in oxygen concentration. Dots are cell positions at 40-ms intervals. When cells leave the band of optimal oxygen concentration (between the dashed lines), they rapidly (within 0.5 to 2 s) return to it by a U-turn. This controlled “steering” of the 10- to 25-μm large T. majus cell stands in contrast to the randomness inherent in the chemotaxis of smaller bacteria, which, unlike T. majus, are affected by Brownian rotational diffusion. Because it is not a response to a gradient but an avoidance of high oxygen concentrations, this behavior is not chemotaxis per se but rather is a phobic response. (Reproduced from reference 49 with permission of the Society for General Microbiology; permission conveyed through Copyright Clearance Center, Inc.) (B) Swimming trajectories of Ovobacter propellens in a plane, with the 0% and 1% oxygen isoclines overlaid. Cells display a strong phobic response for oxygen concentrations above 1% of air saturation. Dots are cell positions at 26-ms intervals. The scale bar is 50 μm. Note that, in contrast to Thiovulum, which executes a U-turn (panel A), Ovobacter reverses direction. (Reproduced from reference 53 with permission. Copyright 2004 Federation of European Microbiological Societies.)

