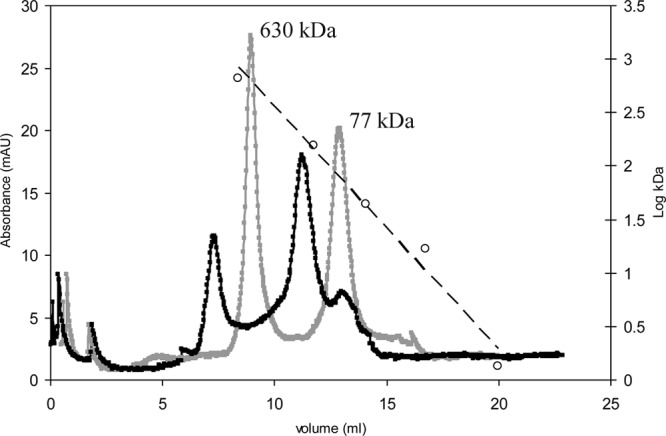
Fig 7.

Study of the molecular mass of CLapF by analytical FPLC. Purified CLapF after treatment with EGTA (gray line) and CLapF incubated with 10 mM CaCl2 (black line) are shown, as well as the molecular masses (open circles) and linear trend (broken line) of the standards. The ∼77-kDa and ∼630-kDa peaks are indicated.
