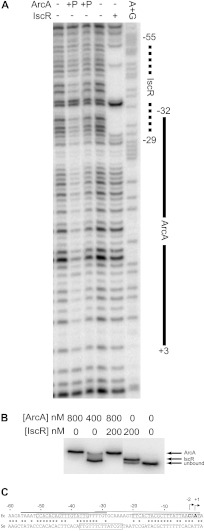
Fig 2.
(A) DNase I footprinting of ArcA and IscR binding to the hyaA promoter region. The labeled DNA is the top strand from −200 to +40 relative to the hyaA transcription start site. Regions protected by IscR (dashed line) or phosphorylated ArcA (solid line) are marked, and numbers are relative to the downstream transcription start site. Lanes 1 and 4 lack IscR or ArcA; lanes 2 and 3 contain 800 nM and 400 nM phosphorylated ArcA, respectively; lane 5 contains 800 nM as-purified IscR; lane 6 is a Maxam and Gilbert A+G ladder made from the same DNA. (B) Electrophoretic mobility shift assay using the same radiolabeled hyaA DNA as the DNase I footprinting assay. Lanes 1 and 2 contain 800 nM and 400 nM phosphorylated ArcA, respectively; lane 3 contains 200 nM as-purified IscR and 800 nM phosphorylated ArcA; lane 4 contains 200 nM as-purified IscR; lane 5 contains no protein. (C) The regulatory region of the hya promoter from E. coli (Ec) and S. enterica (Se). The upstream IscR and downstream ArcA sites are boxed in the E. coli sequence (top). A predicted FNR site is boxed in the S. enterica sequence (bottom). Asterisks indicate conserved residues. The thick line is the IscR footprinted region, and the thin line is the ArcA footprinted region. Arrows indicate the positions of the two transcription initiation sites (31).

