Fig 3.
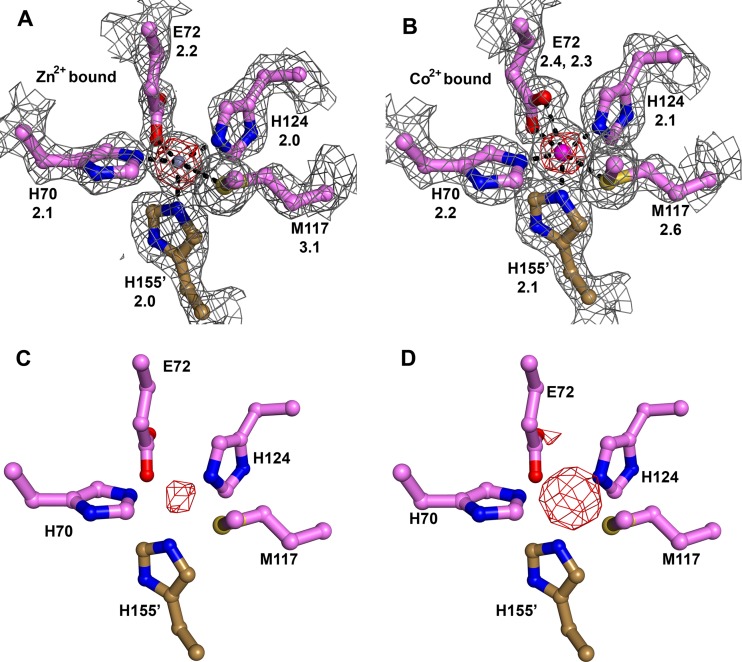
Metal binding in crystalline Tp34. For this figure, all coloration and annotation are as described in the legend to Fig. 2B. In panels A and B, for residues that contact a bound metal ion, the distance in angstroms between the metal ion and the ligand atom is given, and a σA-weighted simulated-annealing omit map (mFo − DFc) contoured at the 3-σ level (gray mesh) is superposed on the final refined models. All atoms shown were omitted for this calculation in these two panels. The positions of the side chains in panels C and D are the same as those in panel A; they are not refined and are shown only for reference. In addition, all parts show an anomalous difference Fourier map (red mesh). The contour level of this map is noted in the legend for each part, with the phrase “anomalous map contour = x.” (A) Zn2+-binding environment. The Zn2+ ion is shown in gray. Secondary structure was omitted for clarity. Anomalous map contour = 15σ. (B) Co2+-binding environment. The Co2+ ion is shown in magenta. Anomalous map contour = 20σ. (C) Anomalous difference Fourier map for Ni2+ bound to Tp34. Map contour level = 5σ. (D) Anomalous difference Fourier map for Cu2+ bound to Tp34. Map contour level = 6σ. The peak at the rear, partially occluded by the carboxylate group of E72, is evidence for Cu2+ binding at site α.

