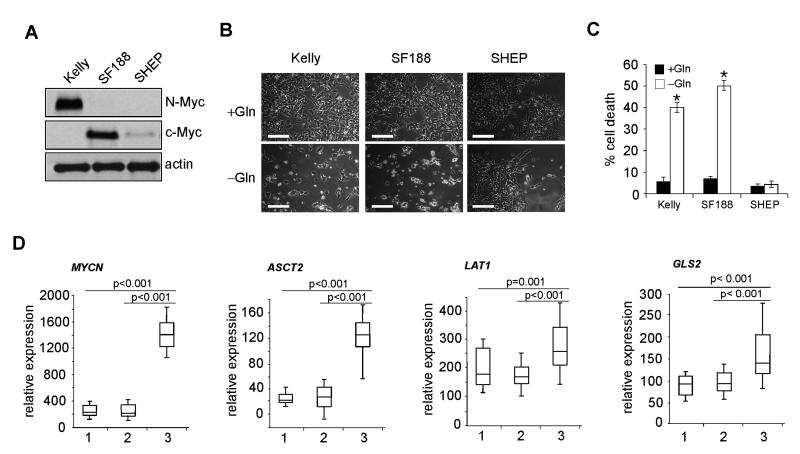
Figure 1. Gln Starvation Triggers Tumor Cell Death in a MYC-dependent Manner.
(A) Western blot analysis of Myc (N-Myc and c-Myc) expression in Kelly, SF188 and SHEP cells. β-actin was used as a loading control.
(B) Representative images of Kelly, SF188 and SHEP cells in the presence or absence of Gln for 48 hr. Scale bars represent 50 μm.
(C) Quantification of cell death by PI-Annexin V staining. Data are presented as an average of triplicates. Error bars represent standard deviation. *p< 0.001.
(D) Relative expression of MYCN, ASCT2, LAT1, and GLS2 in primary neuroblastoma tumors. 1: low-risk group (28 tumors); 2: MYCN non-amplified, high-risk group (32 tumors); 3: MYCN-amplified, high-risk group (20 tumors); defined using International Neuroblastoma Risk Group (INRG) criteria (Maris, 2010). Data are presented as box plots: the box represents 25th percentile through the 75th percentile (the line through the box denotes the median), and the whiskers above and below extend to the 90th and 10th percentiles respectively.
See also Figure S1.

