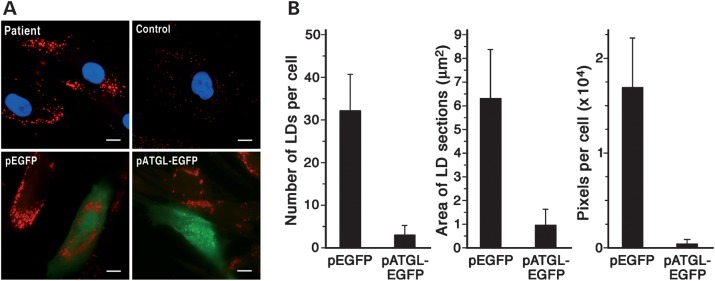
Figure 3.
Correction of the mutant cell phenotype by over expressing wild-type ATGL. (A) Upper images are from fibroblasts from patient 1A and a control cultured at comparable passages in MEM plus Earle's salts containing FBS (10% v/v). Fixed cells (paraformaldehyde, 4% w/v) were stained with ORO and nuclei counterstained with DAPI (blue). Lower images are from the patient's fibroblasts (passage 8) that were cultured in the same medium as above and transiently transfected with either pEGFP or pATGL-EGFP. After 24 h, the cells were fixed and stained with ORO. Fluorescence of EGFP and ATGL-EGFP fusion proteins is in green. Images are representative of four independent transfections. Scale bar: 10 µm. (B) ORO-stained LDs of fibroblasts from patient 1A transfected with either pEGFP or pATGL-EGFP were analyzed for number, dimension (cross-section area) and pixels per cell. The values represent the means of 70–90 cells. Experiments were run in duplicate.

