
Figure 4.
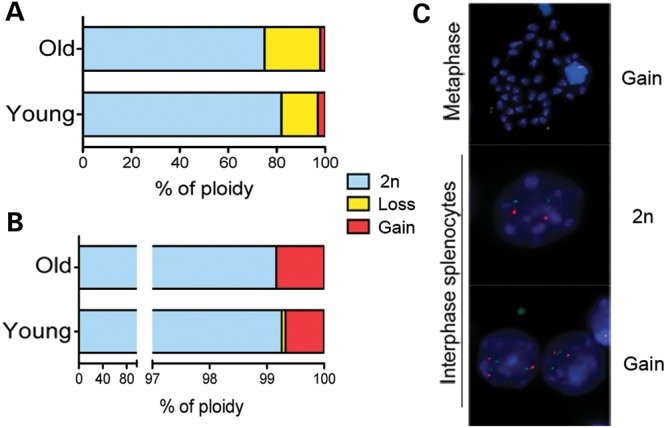
Analysis of ploidy in splenocytes of young and old mice. (A) Chromosomes count in metaphase spreads. (B) 2-color FISH analysis perfprmed on chromosomes 1, 16 and 18 on young FISH analysis on young and old splenocytes revealed that aneuploidy does not increase with age and has similar frequencies for all chromosomes analyzed (plotted average of the four chromosomes). (C) Examples of ploidy detected by two-color FISH analysis for chromosome 16 on splenocytes. FISH signals corresponding to 2n and 2n plus 1 extra chromosome 16 in interphase and metaphase cells are shown.