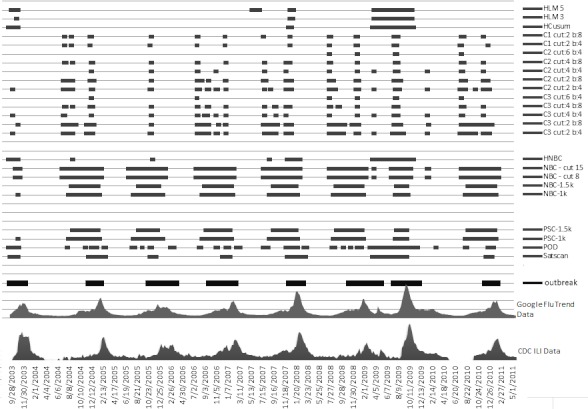
Figure 11.

US Department of Health and Human Services region 6. The x-axis plots the Google Flu Trends and Centers for Disease Control and Prevention (CDC) data. The horizontal bars indicate where each method detected an epidemic. Cut indicates cut-off point (more is less sensitive) and b indicates baseline data (training window). The thick horizontal bar at the bottom shows the actual outbreak. HCusum = historical cumulative sum, HLM = historical limits method, HNBC = historical negative binomial cumulative sum, ILI = influenza-like illnesses, k = reference value for threshold, NBC = negative binomial cumulative sum, POD = Poisson outbreak detection, PSC = Poisson cumulative sum.
