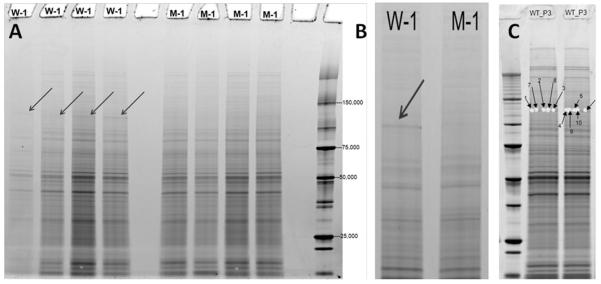
Figure 1.
Gel electrophoresis of Phr1-mutant and control optic nerves. (A) Arrows indicate a band between 100 and 150 kDa which appears to be enriched in wild-type (W-1) compared to mutant (M-1) optic nerves. (B) Higher magnification view of band of interest. (C) Samples were cut out of the identified band from wild-type optic nerve from postnatal day 3 and 13 mice. The interpreted MS2 spectra that support the identification of PHR1 in these samples are shown in Figure S4.

