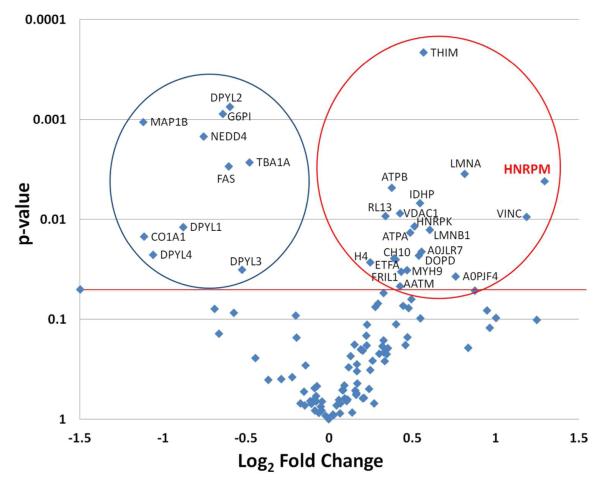
Figure 2.
Volcano plot of differentially expressed proteins in mutant vs. control mouse. ANOVA analysis was performed on the log2 transformed peptide intensity data from replicate optic nerve preparations for WT (n=4) and the Phr1-rko mutant (n=4) using the DAnTE-R software. The aligned intensities for the qualified peptides are given in Table S3. The protein level ANOVA comparisons were performed after using the peptide ‘R-Rollup’ utility in DAnTE-R. Only the proteins that contained a minimum of two unique peptide sequences were quantified using the R-Rollup option and these are listed in Table S4. Proteins with significantly different expression are shown above the thick line. The circle on the left encompasses the proteins (n=10) with significant down regulation in the Phr1-rko mutant compared to WT. Those within the circle on the right (n=20) are proteins that were significantly increased in the mutant versus control mice, including the protein hnRNP-M. The results of the ANOVA including significantly and not significantly changed proteins are given in Table S4.

