
Figure 4.
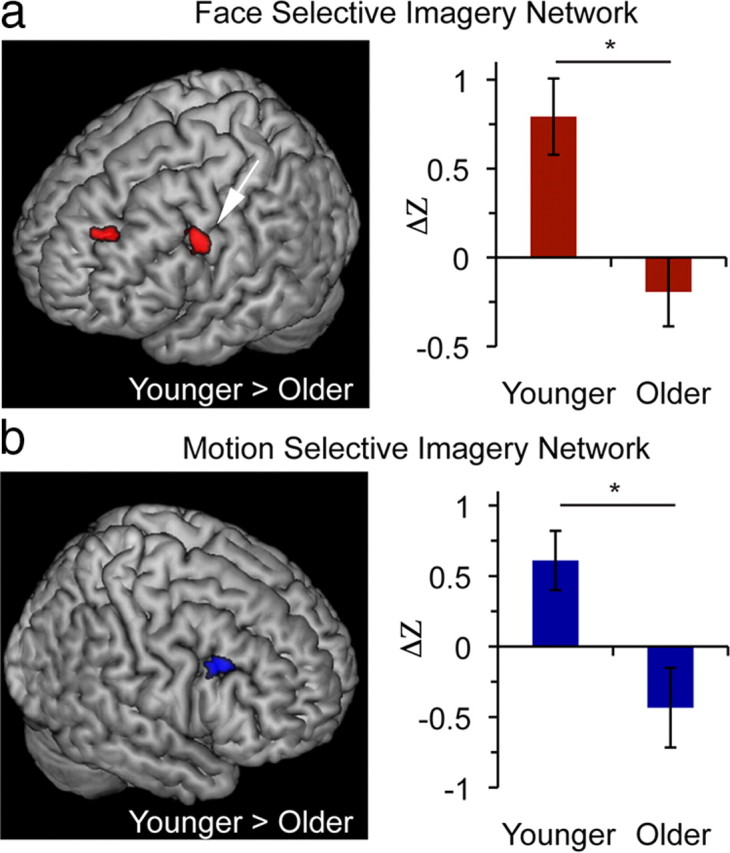
Reduced functional connectivity in older adults. a, b, Between-group contrasts (younger adults > older adults) of imagery networks using face-selective seeds (a) and motion-selective seeds (b) (clusters p < 0.05, corrected; only PFC areas depicted). Face imagery network contrast revealed regions in the right superior frontal gyrus (SFG) and IFJ (a; arrow, IFJ: BA6/44; −60, 12, 39) and motion imagery network contrast revealed a region in the left IFJ (b; BA44; 48, 24, 40). Bar graphs depict connectivity measures in the IFJ regions found to be significant in cluster analysis to illustrate younger and older adult connectivity values that contribute to the results obtained by the whole-brain contrast. Coordinates in MNI. Error bars are ±SEM. *p < 0.01.