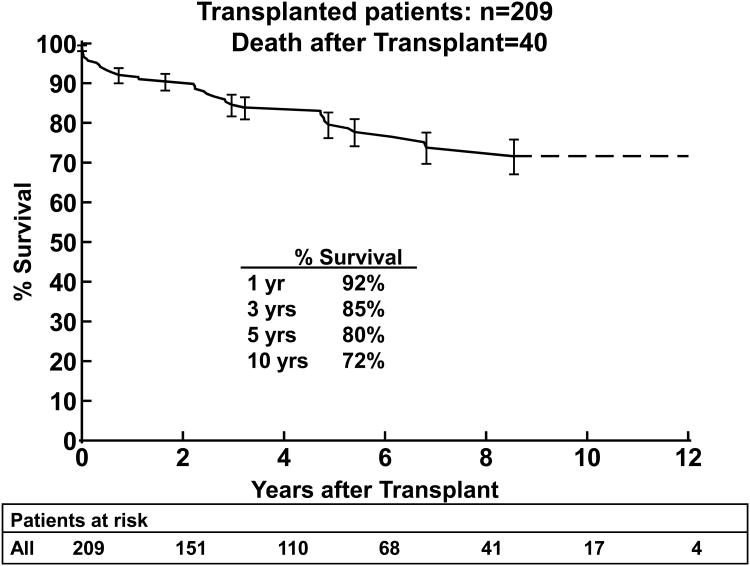
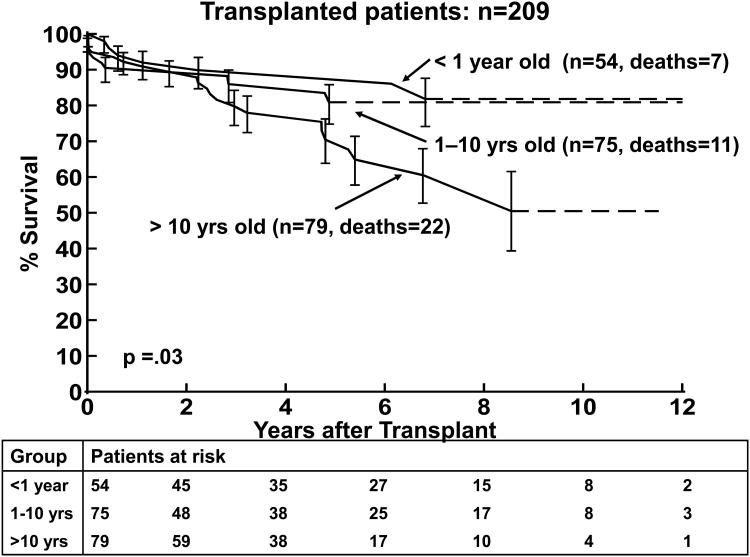
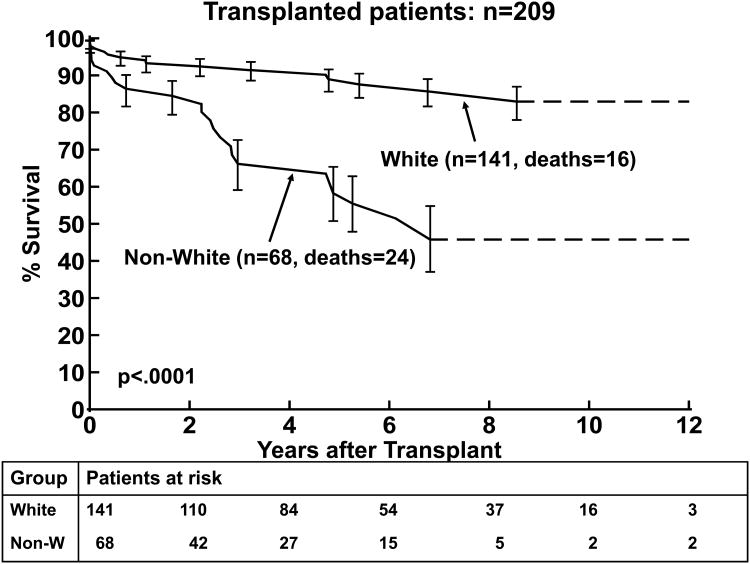
Figure 3.
3(a). Kaplan-Meier post transplantation survival curve for children with DCM (n=209). 3(b). Kaplan Meier post-transplantation curve for children < 1 year, 1-10 years, and >10 years of age at transplantation. 3(c). Kaplan-Meier post–transplantation survival curves for children with non-white versus white race. The error bars represent 70% confidence limits.


