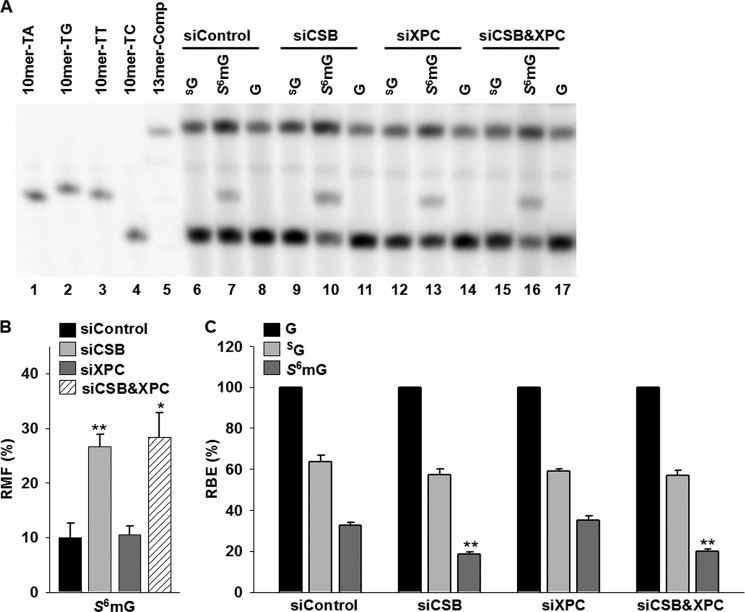
FIGURE 6.
Transcriptional alternations induced by SG and S6mG in 293T cells treated with either or both CSB and XPC siRNAs. A, representative gel images showing the restriction fragments released from the RT-PCR products arising from transcription templates containing SG (lanes 6, 9, 12, and 15), S6mG (lanes 7, 10, 13, and 16), or normal guanine (G, lanes 8, 11, 14, and 17). 10mer-TA, 10mer-TG, 10mer-TT, and 10mer-TC represent standard ODNs d(CTAGNTTTGC), where N is A, C, G, and T, respectively (lanes 1–4, respectively). 13mer-Comp represents standard ODN d(CATCAAGCTTTGC) (lane 5), which corresponds to the restriction fragment arising from the competitor genome. The band observed between 13mer-Comp and 10mer-TT is most likely a nonspecific digestion product and is not lesion-dependent, because it is also obtained with lesion-free control templates. B and C, the RMF values of S6mG (B) and the RBE values of SG and S6mG (C) in 293T cells treated with either or both CSB and XPC siRNAs. The data represent the means and standard error of results from three independent experiments. *, p < 0.05; **, p < 0.01. The p values were calculated by using unpaired two-tailed Student's t test.

