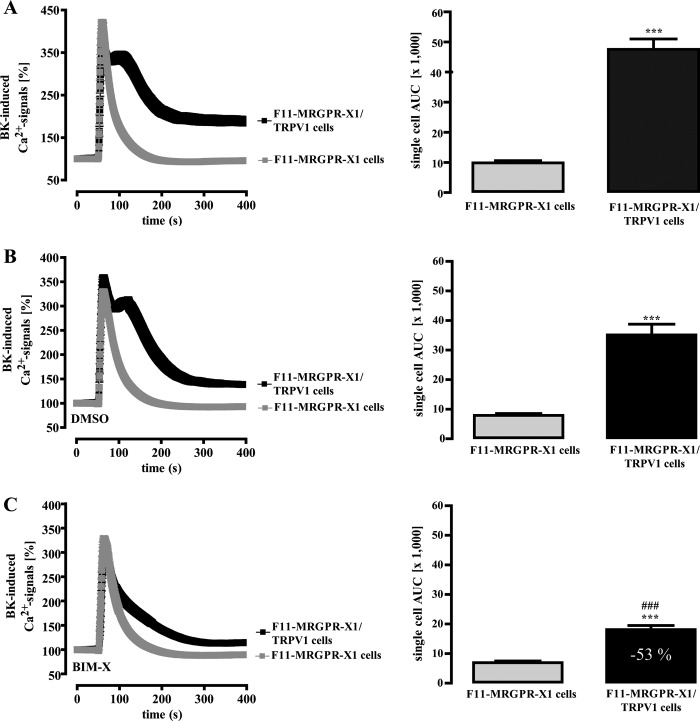
FIGURE 5.
B2R-induced TRPV1 activation is dependent on PKC activity. Ca2+ signals in fura2-loaded F11-MRGPR-X1 or F11-MRGPR-X1/TRPV1 cells were monitored. BK (100 nm, final) was manually injected at time point 50 s. In B, cells were preincubated with the carrier DMSO (0.1%, 30 min), and in C cells were preincubated with BIM-X (1 μm, 30 min). Data from 3–5 independent experiments were compiled, normalized by defining the first value (0.5 s) measured as 100%, and expressed as the mean ± S.E. The AUC for each measured cell was determined, and data of all cells were compiled and expressed as the mean ± S.E. and presented in bar graphs. Asterisks indicate a significant difference (***, p < 0.001) between F11-MRGPR-X1/TRPV1 and F11-MRGPR-X1 cells; hash signs indicate a significant difference (###, p < 0.001) between BIM-X (C)- and DMSO (B)-treated F11-MRGPR-X1/TRPV1 cells.

