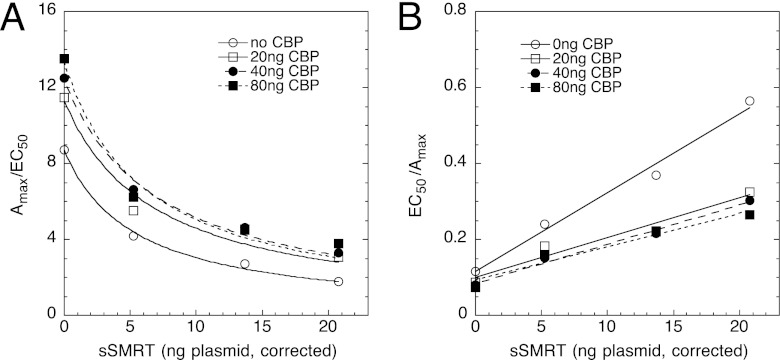
FIGURE 2.
Competition assay for CBP and sSMRT during GR-mediated induction in U2OS cells. Assays were conducted as described for Fig. 1F. Graphs of Amax/EC50 versus sSMRT (A), and EC50/Amax versus sSMRT (B) at different concentrations of the other factor, CBP, were constructed and analyzed as detailed under “Results.” Graphs shown are for a single representative experiment (total = 5).

