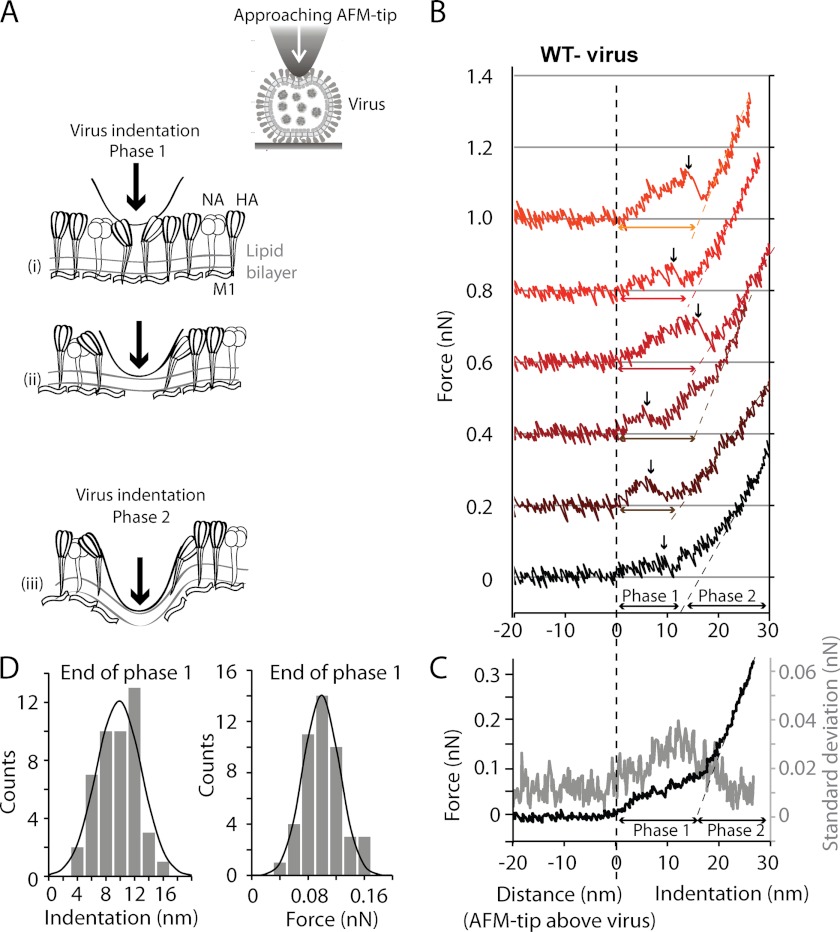
FIGURE 2.
Successive force-indentation curves obtained with an individual A/X-31 virion (diameter ∼116 nm) consistently show a biphasic response. A, schematic of the force spectroscopy experiment. During phase 1 of virus indentation, HA and NA, connected to the matrix protein M1 at the luminal side of the lipid bilayer, are pushed apart (i and ii). During phase 2 (iii), the lipid bilayer and associated proteins are indented by the AFM tip. B, six successive force-indentation curves performed on top of a single virion. The initial indentation up to about 10 nm (phase 1) contains steps (black arrows) and shows considerable variability between the curves. At increasing deformation, the curves appear more similar. Force-indentation curves were aligned using the part of the curve between 100 and 200 pN in phase 2. C, the averaged force-indentation curve (black) of the data shown in B shows the biphasic response, with a transition from soft to stiff at about 100 pN of force. The S.D. of the ensemble of the six curves is shown in gray. D, a linear fit was applied to each force-indentation curve for forces of ≥100 pN in phase 2. Extrapolation of each linear fit to zero force was used to determine the indentation in nanometers reached at the end of phase 1. The histograms show the distribution of indentation and of the forces reached at the end of phase 1 (46 force-indentation curves measured on nine virions).

