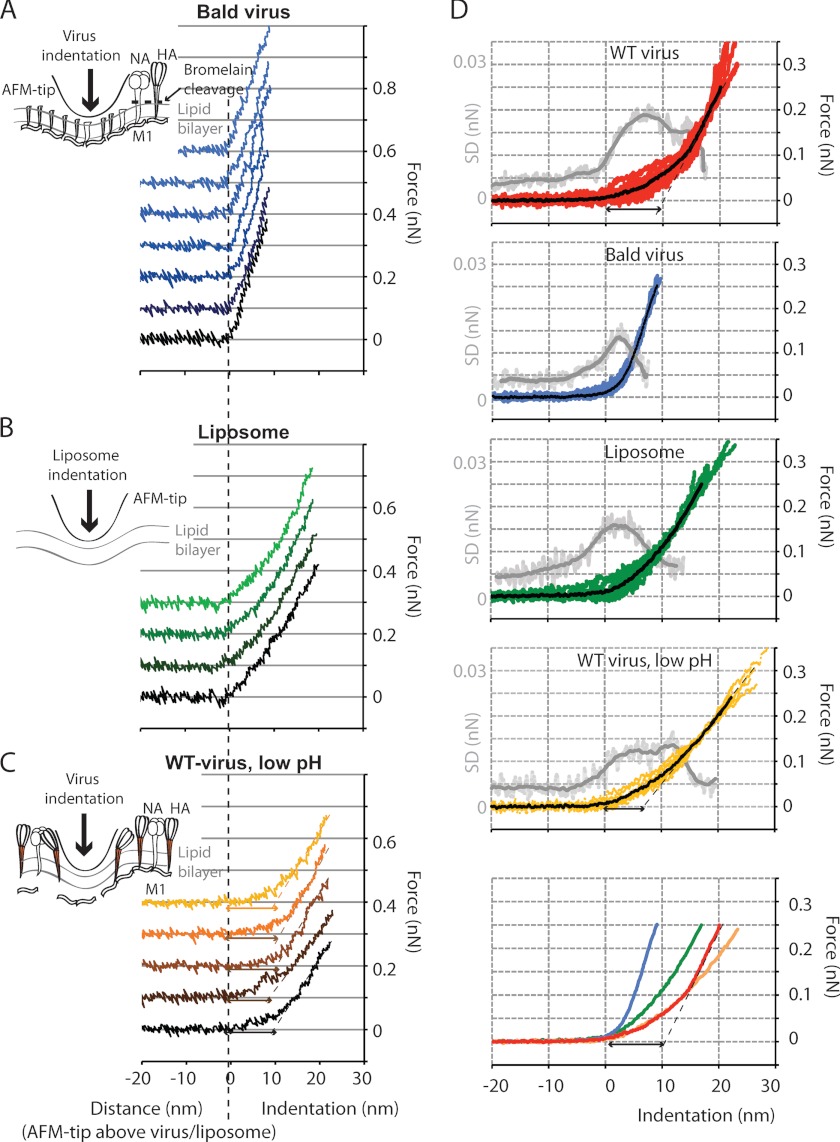
FIGURE 4.
Comparison of force-indentation curves obtained with untreated (WT), bromelain-treated (bald), pH 5-treated virus, and liposomes of similar size (viruses 85–95 nm in diameter, liposomes 75–95 nm in diameter). A, seven successive force-indentation curves were measured on a bald virion. The soft initial response (phase 1) and stepwise indentation at ∼100 pN observed with untreated virus are absent. The stiffness was higher than that of the untreated virus or liposomes. B, the response of liposomes was similar to that of bald viruses, but the stiffness was lower. C, the pH 5-treated virus shows a response similar to untreated virus. The stiffness in phase 2 was slightly lower and more similar to that of the liposome. D, for nine untreated virions, the average curves (red) were calculated from 3–8 individual indentation curves/virus. The average of these is shown in black. The light gray curve shows the S.D. of the ensemble, and the mean of the S.D. is shown in dark gray and was calculated over a running window of 60 data points. For nine bald virus particles (eight liposomes and seven pH 5-treated virions, respectively), the averaged curves were calculated from 4–16 individual force-indentation curves/particle (3–5 individual force-indentation curves/particle for the liposomes and the pH 5-treated virions, respectively). The bottom panel shows all averaged force-indentation curves in one plot.

